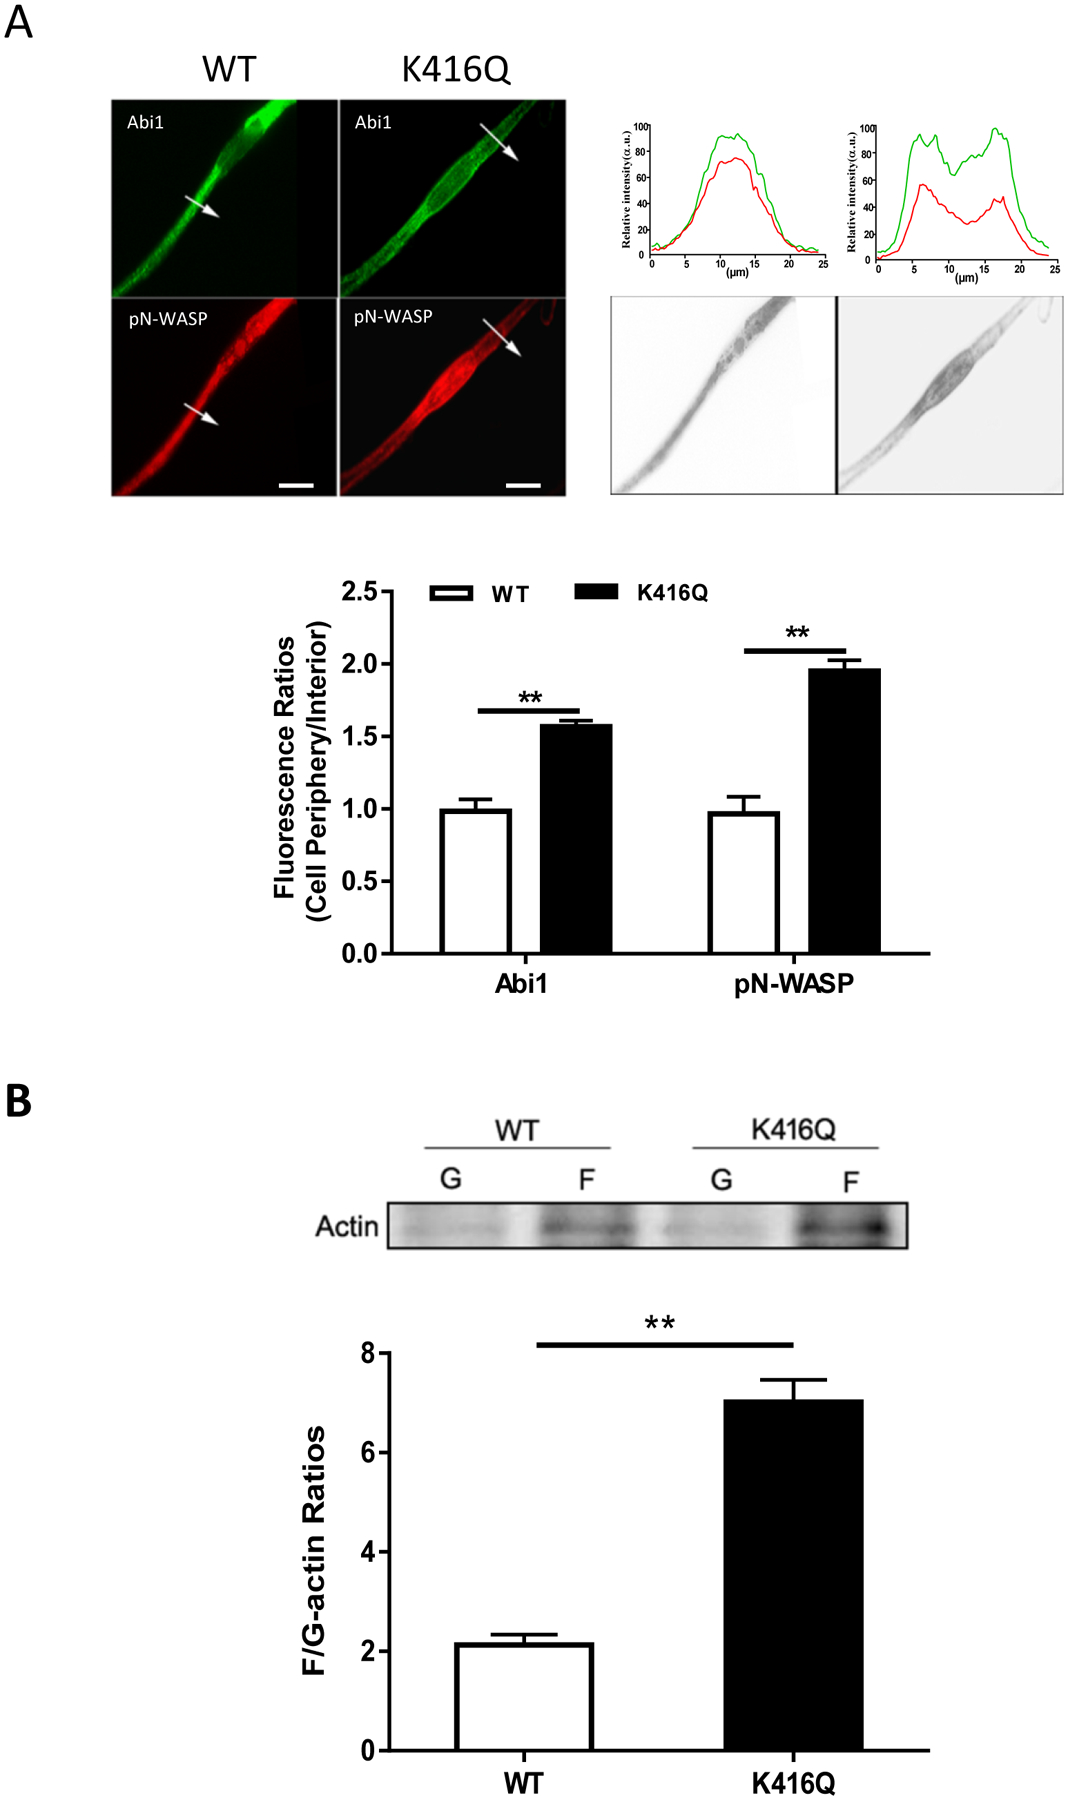
Figure 4. Acetylation of K416 enhances the translocation of Abi1 and pN-WASP and actin polymerization.

A. Cells expressing WT or K416Q Abi1 were immunostained for Abi1 and pN-WASP. Data are mean values of 3 batches of cell culture. The arrows indicate a single line scan to quantify the fluorescent signals in cells. The line scan graphs show relative fluorescent intensity. Image analysis for protein localization was described in the section of Methods. Black/white images show the shape and edge of these cells. Scale bar, 10 μm. Error bars indicate SE. B. F/G-actin ratios of cells expressing WT or K416Q Abi1 were evaluated using the immunoblot analysis. Data are mean values of 4 batches of cell culture. Error bars indicate SE. ** p < 0.01.
