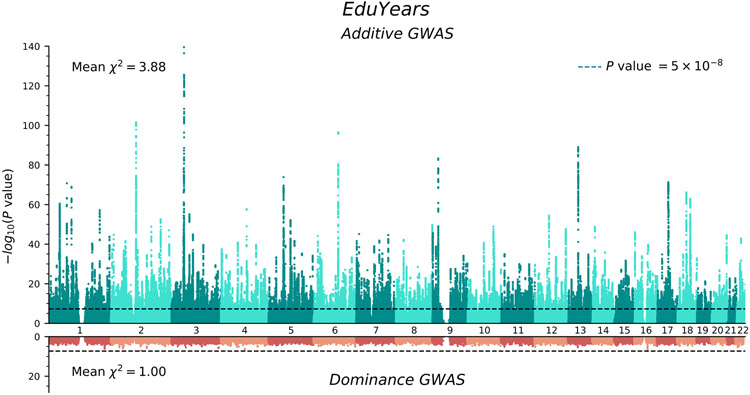
Figure 1. Manhattan plots for the additive and dominance GWAS.
The top panel (green) is the additive GWAS (n = 3,037,499 individuals), and the bottom panel (red) is the dominance GWAS (n = 2,574,253 individuals). The P value and mean χ2 value are based on inflation-adjusted two-sided Z-tests. The x axis is chromosomal position, and the y axis is the significance on a −log10 scale. The dashed line marks the threshold for genome-wide significance (P = 5 × 10⁻⁸).

