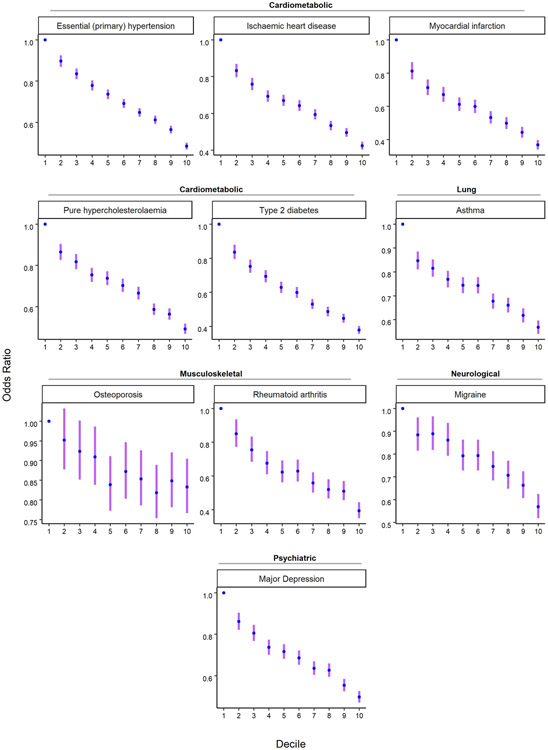
Extended Data Fig. 9. Odds ratio for selected diseases by deciles of the EA PGI in the UK Biobank.
The EA PGI was discretized into deciles (1 = lowest, 10 = highest), and nine dummy variables were created to contrast each of deciles 2-10 to decile 1 as the reference. Odds ratio and 95% confidence intervals (the error bars) were estimated using logistic regression while controlling for covariates (sex, a third-degree polynomial in birth year and interactions with sex, the top 40 PCs, and batch dummies).

