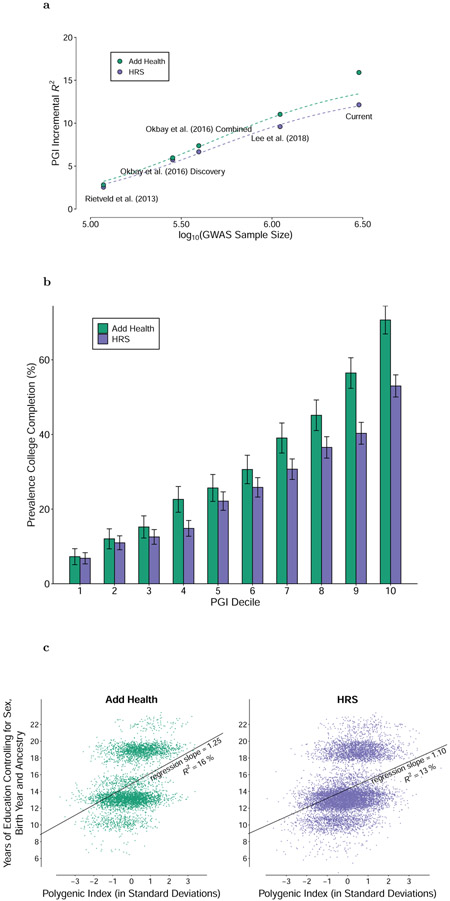
Figure 2. Polygenic prediction.
Panel (a): Predictive power of the EA PGI as a function of the size of the GWAS discovery sample, with expected predictive power shown by the dashed lines (see Supplementary Note section 5.5). Panel (b): Prevalence of College Completion by EA PGI decile, with 95% confidence intervals. Panel (c): Scatterplot of EA PGI (residualized on 10 PCs) and EduYears (residualized on sex, a full set of birth-year dummies, their interactions, and 10 PCs). Prediction samples for all panels are European-ancestry participants in the National Longitudinal Study of Adolescent to Adult Health (Add Health, N = 5,653) and the Health and Retirement Study (HRS, N = 10,843). All PGIs were constructed from EduYears GWAS results that exclude Add Health and HRS, using the software LDpred assuming a normal prior for SNP effect sizes. Incremental R2 is the difference between the R2 from a regression of EduYears on the PGI and the controls (sex, a full set of birth year dummies, their interactions, and 10 PCs) and the R2 from a regression of EduYears on just the controls. The individual-level data plotted in Panel (c) have been jittered by adding a small amount of noise to each observation.

