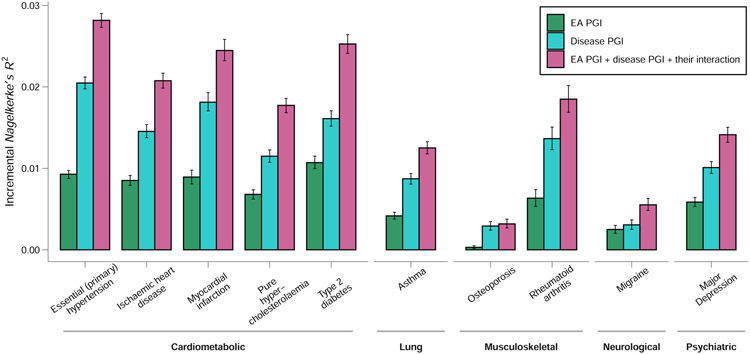
Figure 3. Predictive power of the EA PGI, the disease-specific PGI, and their combination for ten diseases in the UK Biobank.
For each disease phenotype, the figure shows the incremental Nagelkerke’s R2 from adding the EA PGI, the disease PGI, or both PGIs and their interaction to a logistic regression of the disease phenotype on covariates. The covariates are sex, a third-degree polynomial in birth year and their interactions with sex, the first 40 PCs, and batch dummies. The error bars represent 95% confidence intervals calculated with the bootstrap percentile method, with 1,000 repetitions.

