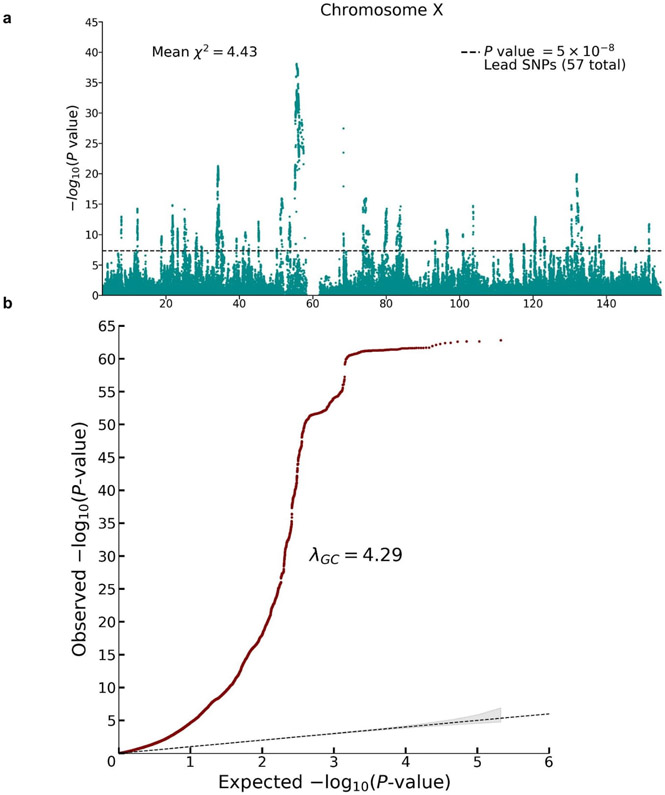
Extended Data Fig. 4. Meta-analysis of X chromosome SNPs (N = 2,713,033 individuals).
The meta-analysis was conducted by combining summary statistics from (pooled-sex) association analyses conducted in UK Biobank (N = 440,817 individuals) and 23andMe (N = 2,272,216 individuals); see Supplementary Note section 3.4 for details. Panel (a): Manhattan plot, in which P values are based on summary statistics adjusted for inflation using the same LD score intercept used in the autosomal analyses. The solid line indicates the threshold for genome-wide significance (P = 5 × 10⁻⁸ based on a two-sided Z-test adjusted for multiple comparisons). Panel (b): Q-Q plot, in which P values are based on unadjusted Z-test statistics. The dotted line represents the expected -log10(P-values) under the null hypothesis. The (barely visible) gray shaded area in represents the 95% confidence intervals under the null hypothesis.

