
Figure 4.
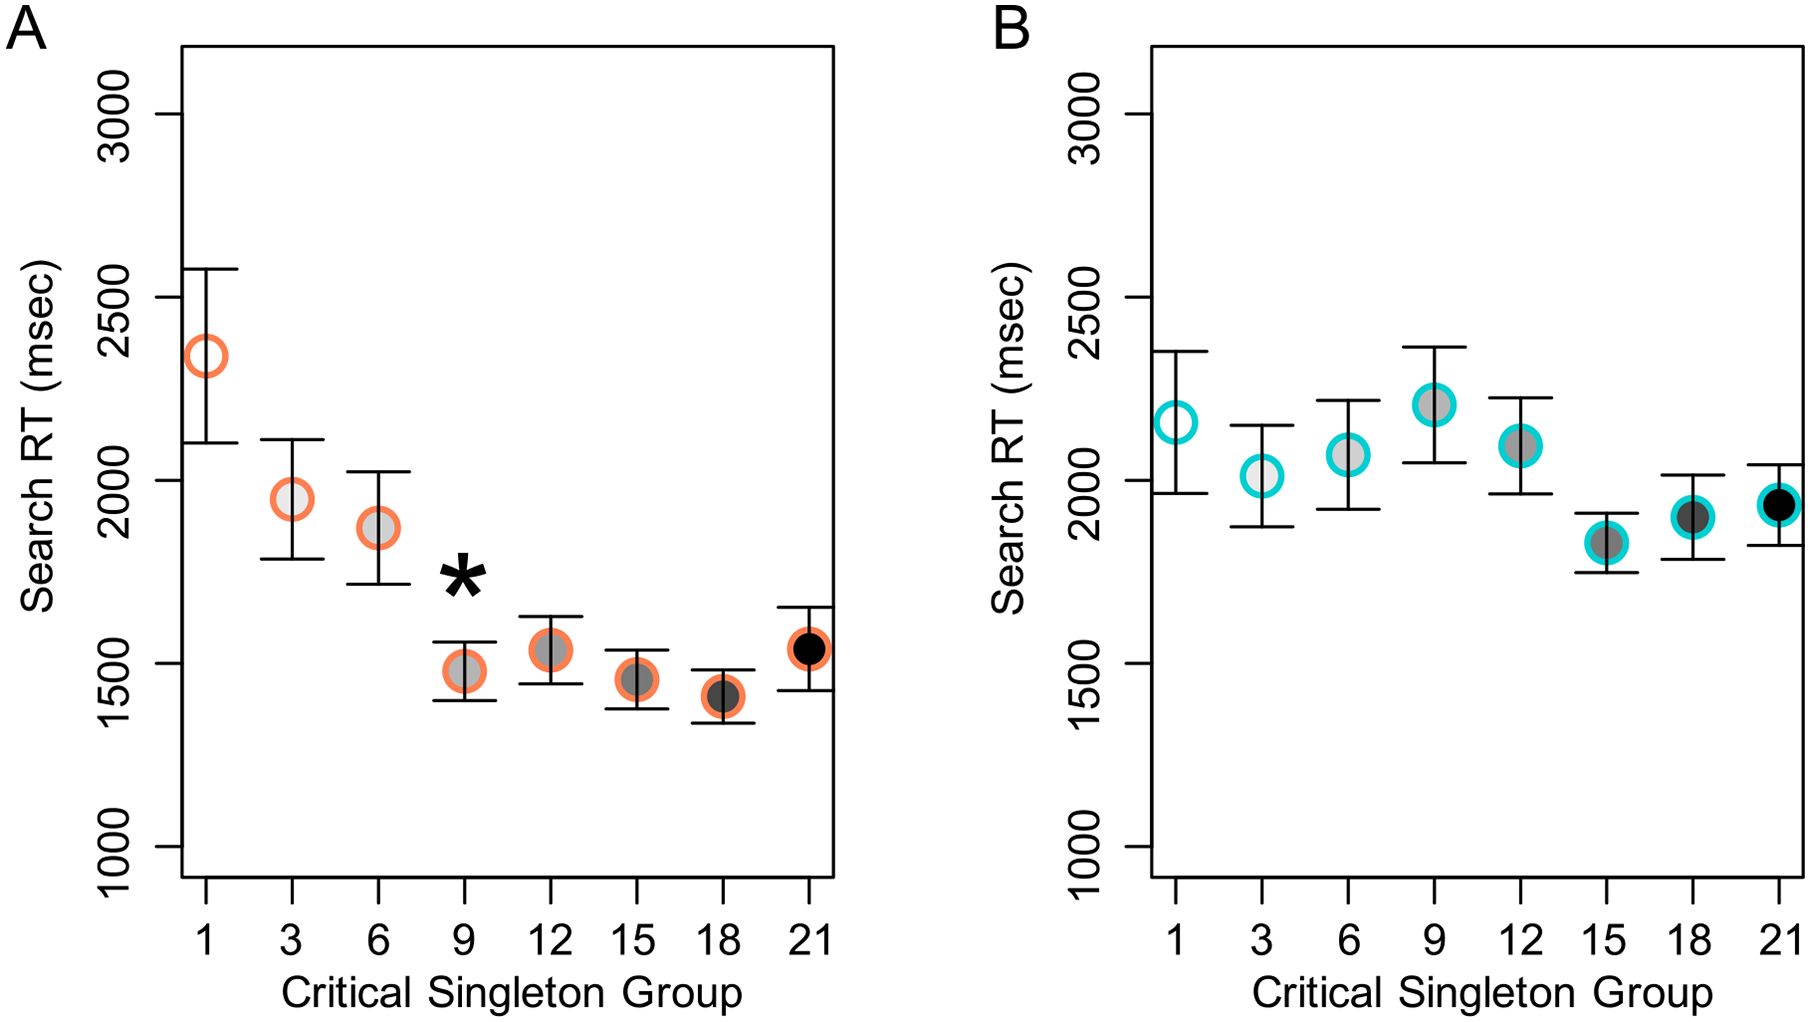
Mean search RT for the critical singleton trial across eight groups. A. Experiment 1A. The “*” indicates the knot point of the best fitting model. B. Experiment 1B. Error bars indicate ±1 standard error of the mean.
Official websites use .gov
A
.gov website belongs to an official
government organization in the United States.
Secure .gov websites use HTTPS
A lock (
) or https:// means you've safely
connected to the .gov website. Share sensitive
information only on official, secure websites.
Mean search RT for the critical singleton trial across eight groups. A. Experiment 1A. The “*” indicates the knot point of the best fitting model. B. Experiment 1B. Error bars indicate ±1 standard error of the mean.