Figure 9.

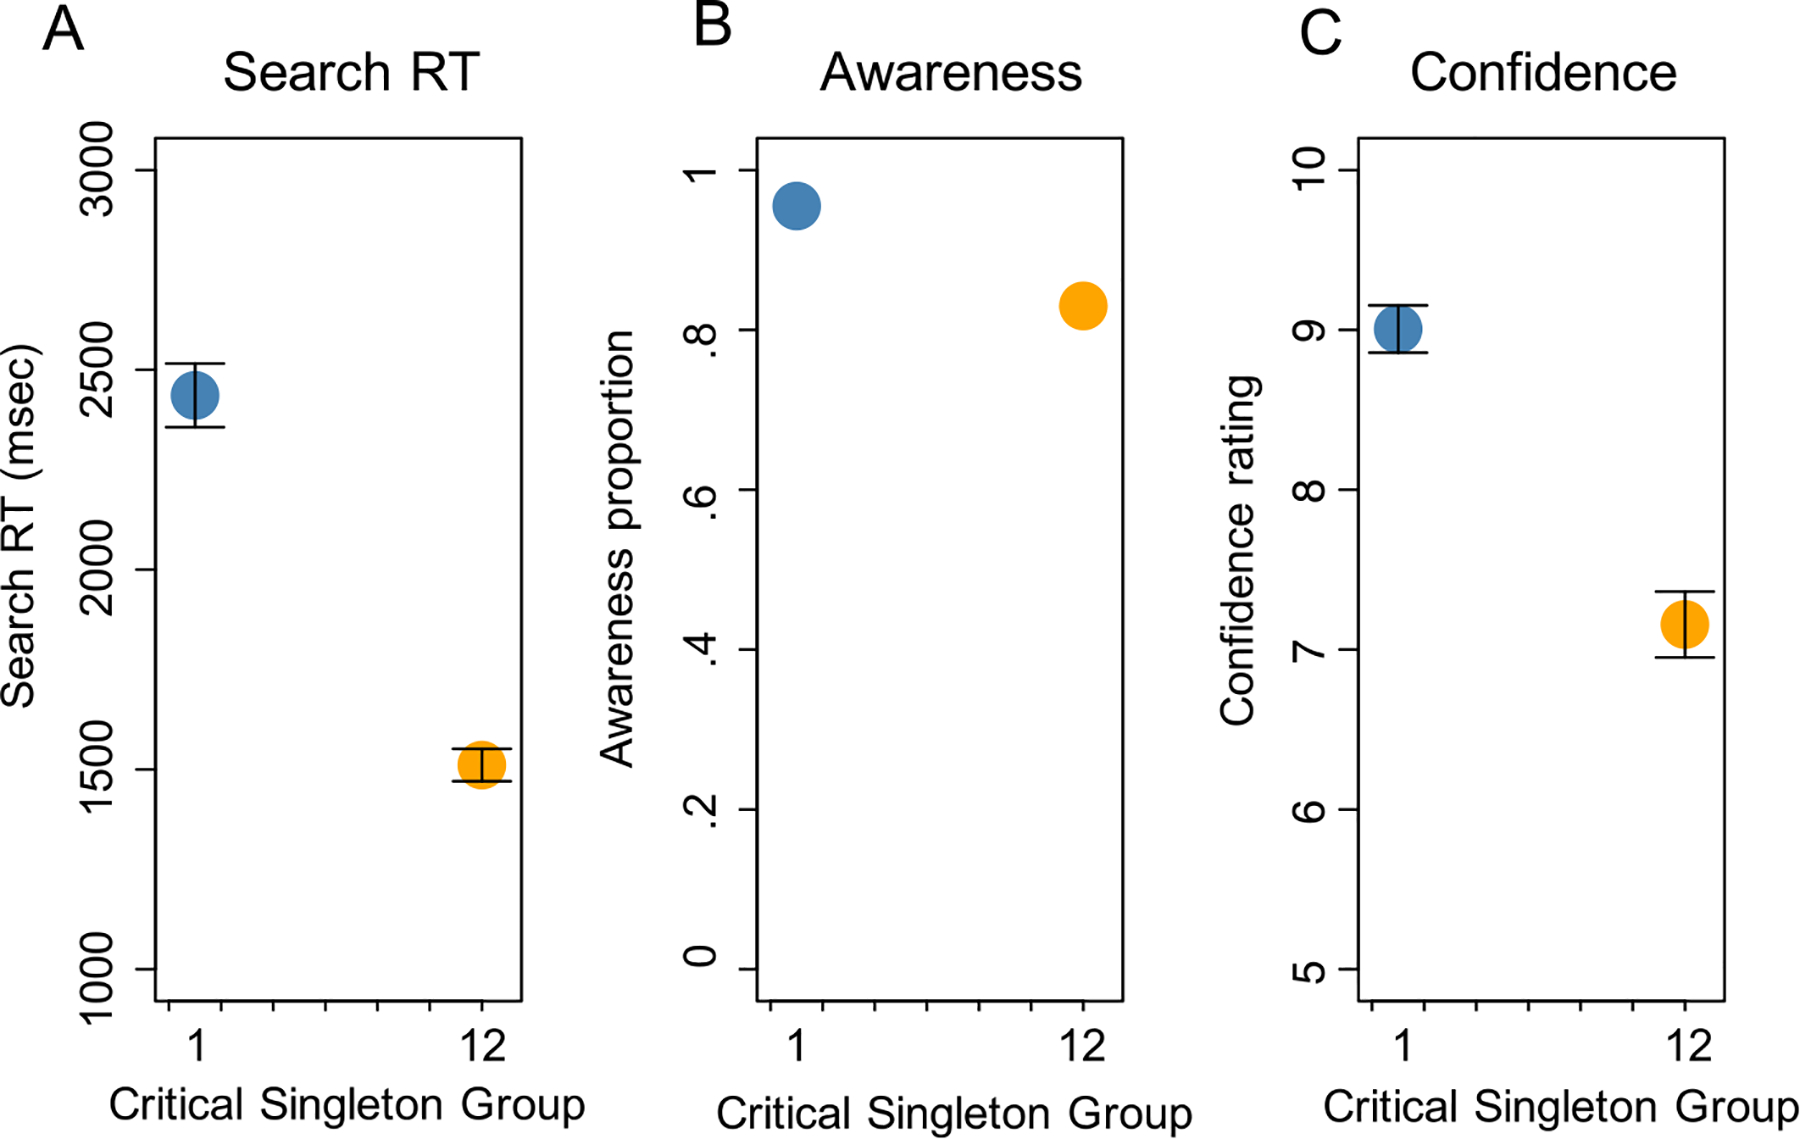
A. Mean search RT for the critical singleton trial between the trial-1 group (blue circle) and the trial-12 group (orange circle). B. Awareness proportion. C. Confidence ratings. Error bars indicate ±1 standard error of the mean.

A. Mean search RT for the critical singleton trial between the trial-1 group (blue circle) and the trial-12 group (orange circle). B. Awareness proportion. C. Confidence ratings. Error bars indicate ±1 standard error of the mean.