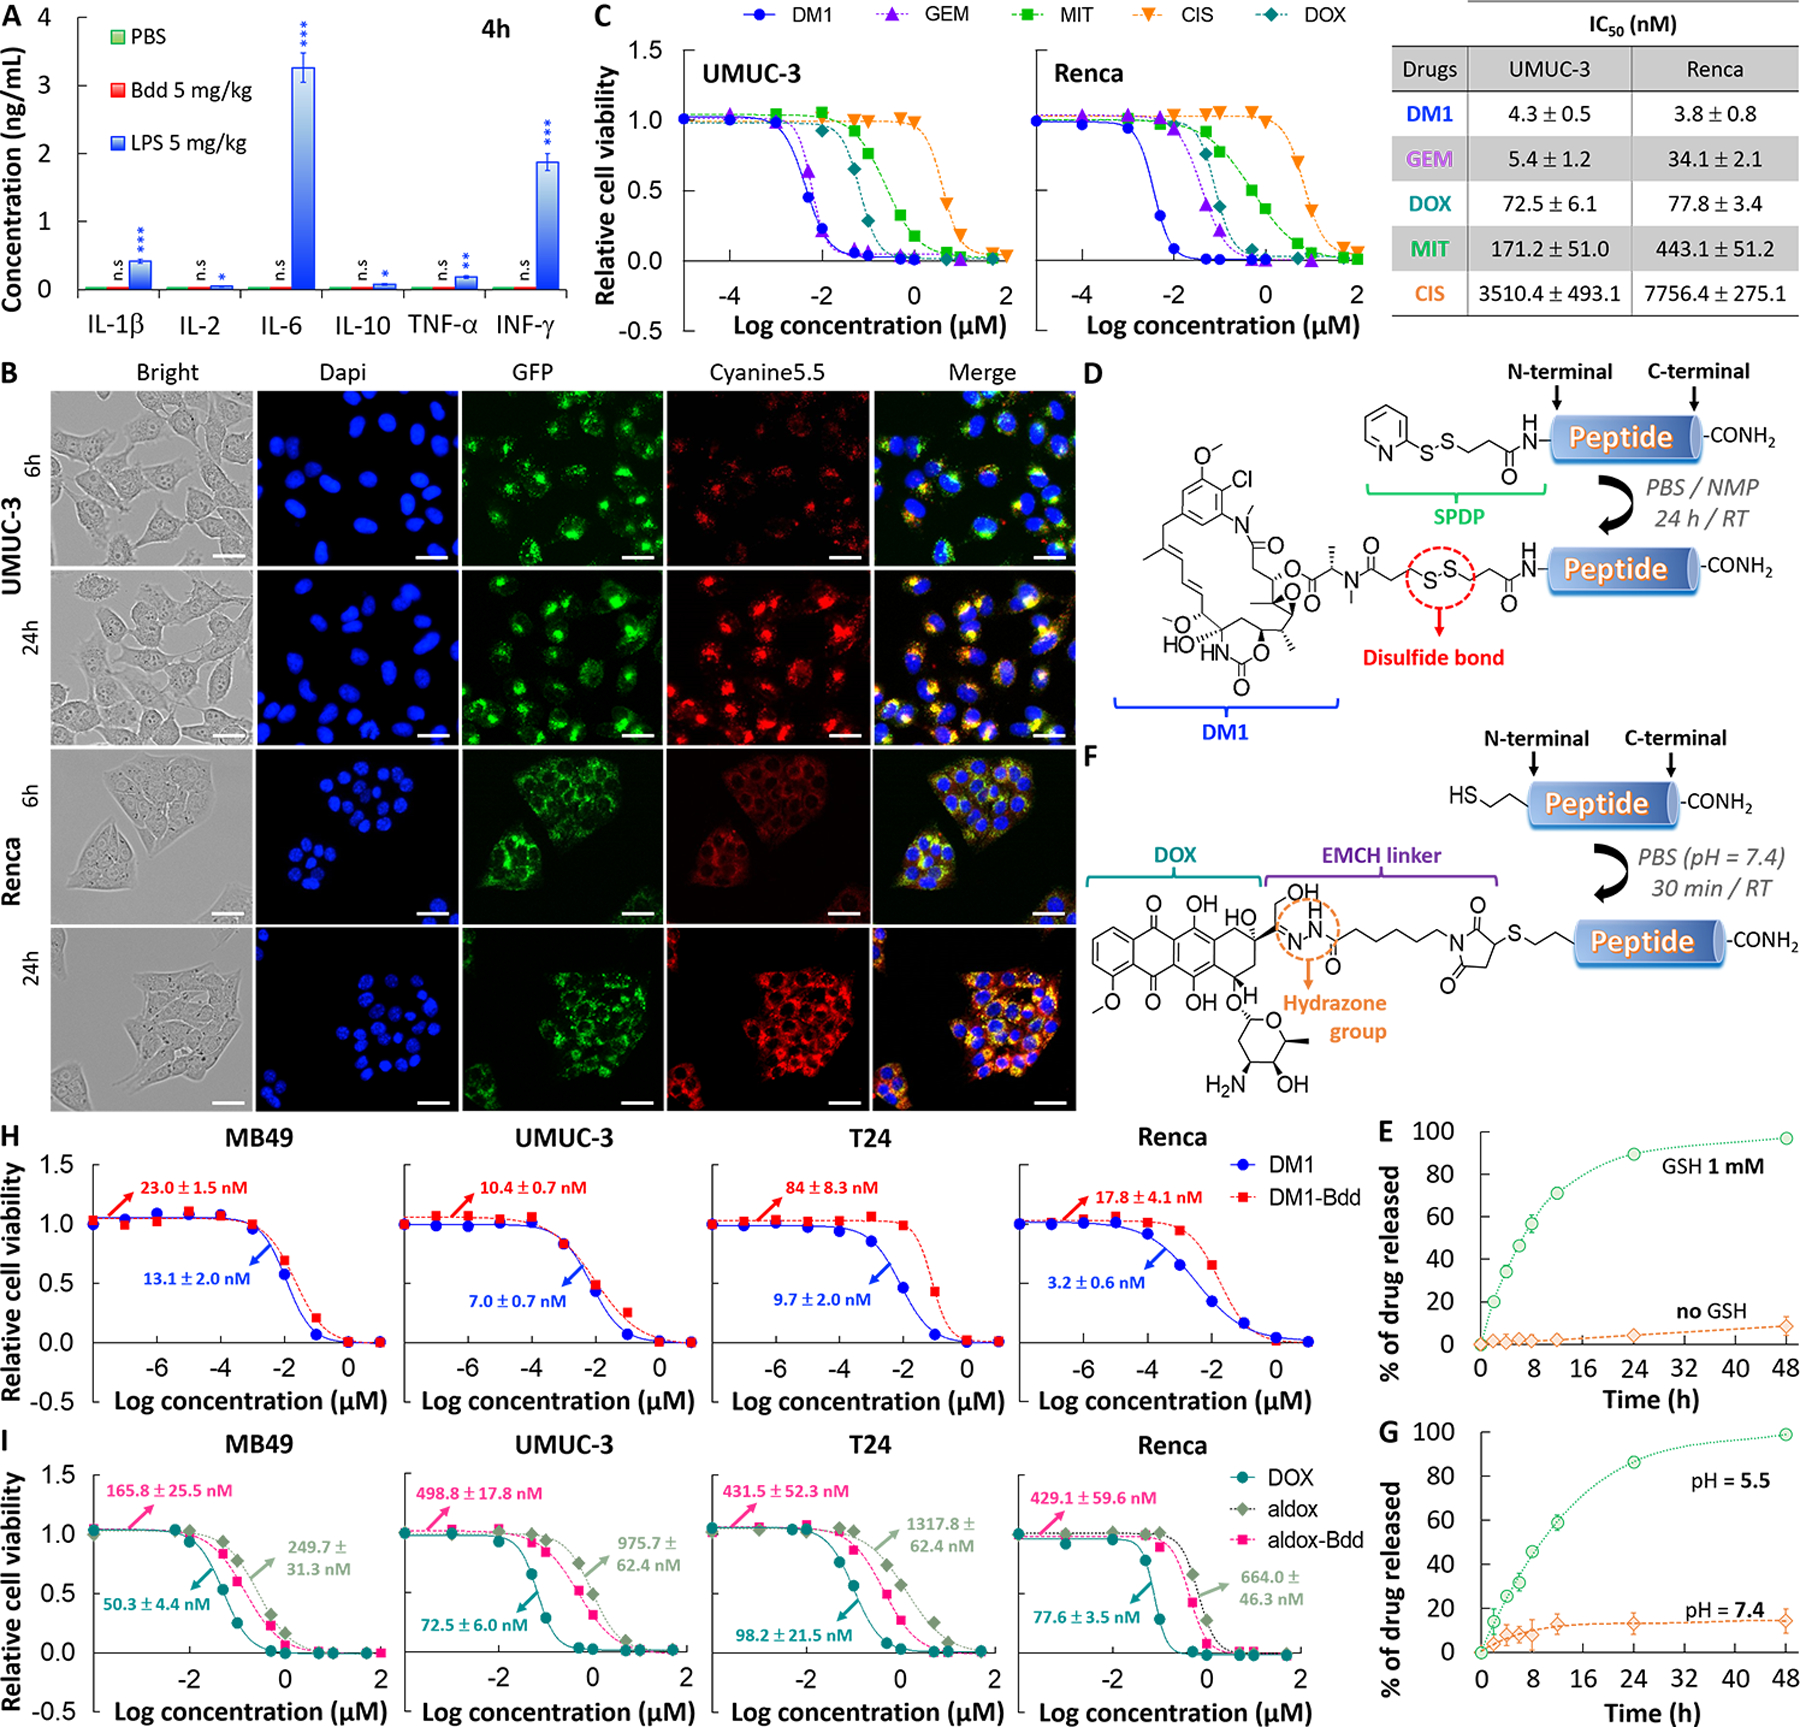
Fig. 3: Bdd as a carrier of chemotherapeutics.

A, Bdd does not trigger any innate immune response. No increase in the inflammatory cytokines concentrations was detected in the plasma of female BALB/cJ mice (n=3/group) 4 h after i.v. administration of the Bdd peptide (5 mg/kg, 150 μL). LPS was used as a positive control and concentrations of each cytokine were measured by ELISA kit. B, Cellular uptake of Cyanine5.5-labeled Bdd (Cy-Bdd). Representative fluorescence microscopic images of human UMUC-3 BC cells and murine Renca renal adenocarcinoma cells incubated for 6 and 24 h with Cy-Bdd (0.5 nmol). Dapi (9 μM) and LysoTracker-GFP (1 μM) were used for nuclear (blue) and organelle (green) staining, respectively, and were added to the cells 30 min prior to imaging. Scale bar is 25 μm. C, Comparing the potency of different chemotherapeutics (DM1, GEM, MIT, CIS, and DOX). UMUC-3 and Renca cells were incubated with the drugs at various concentrations for 72 h prior to measuring the cell viability. The dose response curves were plotted and the half maximal inhibitory concentrations (IC50 values) of each drug calculated using Graph Pad Prism 6.0 software. D, Conjugation of DM1 to Bdd. The cleavable linker SPDP was first conjugated to the peptide N-terminal in solid phase. DM1 was then added to the cleaved peptide in a solution mixture of PBS and NMP. E, Plot showing the percentage of accumulated DM1 released from the DM1-Bdd over time in PBS in the absence and presence of GSH (1 mM). The amount of drug released was quantified using rp-HPLC analysis (absorbance detected at 254 nm). F, Conjugation of aldox to Bdd. The peptide, supplemented with a N-terminal cysteine, was incubated with aldox in PBS (pH = 7.4) for 30 min prior to purification by rp-HPLC in neutral conditions. G, Plots showing the percentage of the accumulated DOX active metabolite released from aldox-Bdd (100 μM) over time in PBS buffers with different pH values. The amount of drug released was quantified using rp-HPLC analysis (absorbance detected at 480 nm). H, DM1-Bdd displays a similar cytotoxicity compared to free drug against murine bladder (MB49), human bladder (UMUC-3 and T24), and murine kidney (Renca) cancer cell lines. Plots of relative cell viability against the drug concentration. I, Aldox-Bdd is more potent than free aldox. Plots of the relative cell viability against the drug concentration.
