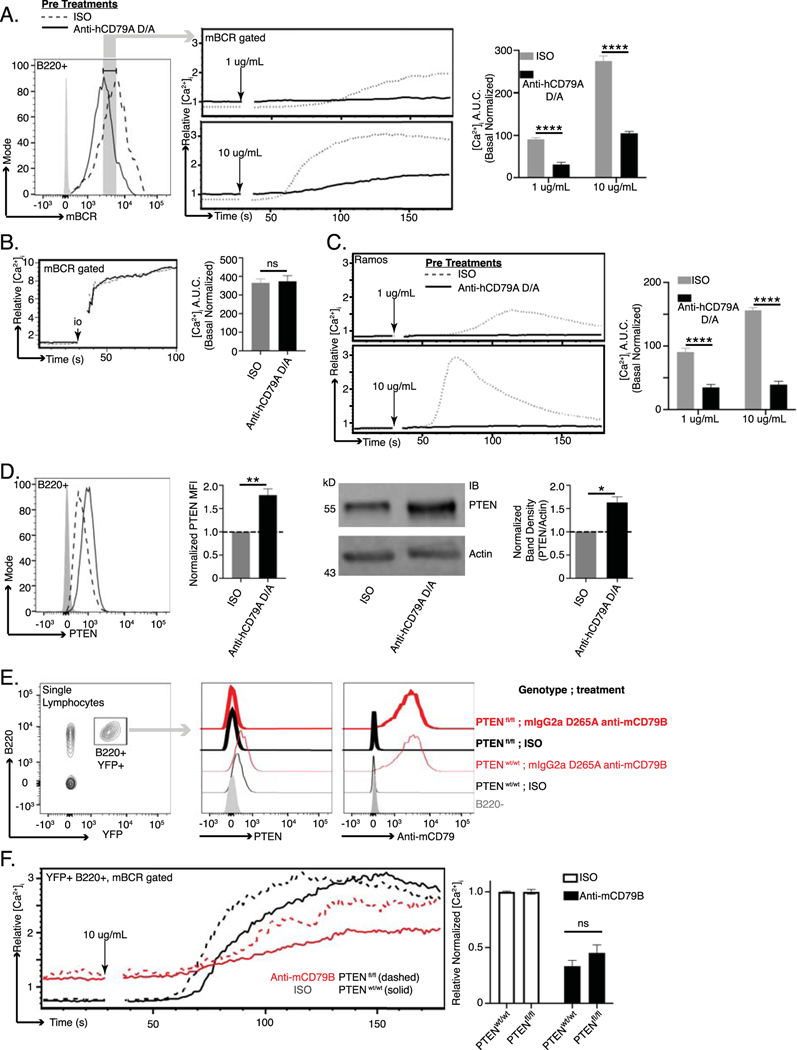
Fig 4. Anti-human CD79A treatment induces suppression of BCR-mediated calcium mobilization.
(A.) BCR-mediated calcium signaling in B cells from cCD79A mice receiving 250 μg IP injection of anti-human CD79A D265A or control hIgG4 24 hours prior. mBCR expression (left) was measured and gated by staining with a polyclonal goat fab anti-mouse IgG (H+L). Anti-hCD79A (solid); control hIgG4 (dashed). Cells were restimulated with 1 or 10 μg/mL rat anti-mouse IgM [B76]. Post stimulation area under the curve (AUC) was normalized to basal calcium levels (right). (B.) Cells prepared as in A. stimulated with 10 μM ionomycin. (C.) BCR-mediated calcium signaling in Ramos cells after overnight in vitro incubation with 25 μg/mL human IgG4 anti-hCD79A D265A (solid line) or isotype control hIgG4 (dashed line). Cells were restimulated with either 1 or 10 μg/mL goat F(ab’)2 anti-human IgM Cμ5. (D.) Flow cytometric (left and MFI bar graph) and western blot (right and densitometry) analysis of PTEN expression in B cells from cCD79A animals receiving 250 μg IP injection of either anti-human CD79A D265A or control hIgG4, 24 hours prior. For flow cytometry, RBC-lysed splenocytes were fixed and permeabilized before staining with antibodies against B220 and PTEN. Gray histogram represents staining isotype control antibody. hIgG4 (dashed line), anti-hCD79A D265A (solid). For western blot, membranes were prepared as in 3D, without BCR stimulation, before being probed with antibodies against PTEN or actin. (E.) hCD20-CreTAM X ROSA26-STOPflox-YFP X PTENflox/flox or hCD20-CreTAM X ROSA-26-STOPflox-YFP X PTENWT mice were given 2 mg IP injections of tamoxifen (TAM) on d0. Day 7 post-TAM, mice were injected IP with 0.25 mg of either mouse IgG2a D265A anti-mouse CD79B or control mouse IgG2a anti-HEL. 18 hours post antibody injection, B220+YFP+ splenocytes were analyzed by flow for PTEN expression and antibody coating. (F.) As before, calcium was measured as a function of equal mBCR expression. n= 3 mice per group. Error bars show SEM. Student’s t-test used to evaluate statistical significance. *, p<0.05; **, p<0.01; ***, p<0.001; ****, p<0.0001. All data represents at least 3 independent experiments, representative data shown.

