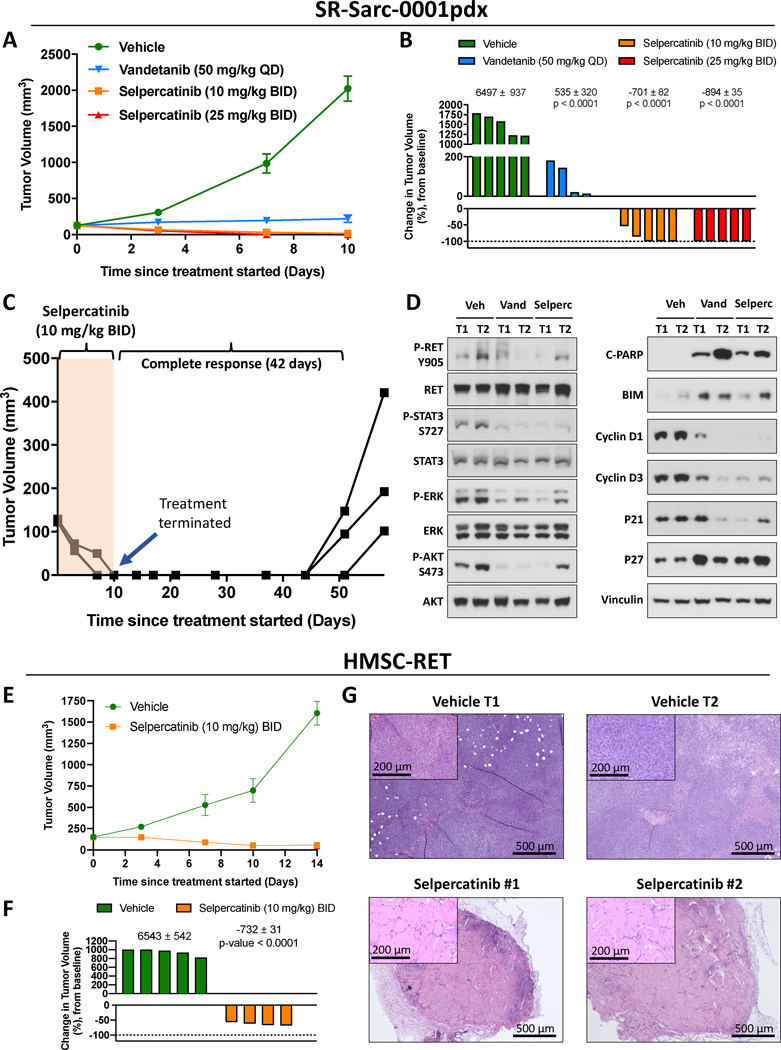
Figure 4. In vivo efficacy of RET inhibition in RET-rearranged sarcoma models.
A. SR-Sarc-0001pdx tumors were implanted into the subcutaneous flank of NSG mice. Treatment commenced 13 days after implantation. Data represents the mean ± SE of five tumors per group. While no tumor regression was observed with vandetanib, both selpercatinib 10 mg/kg BID and 25 mg/kg BID induced complete responses in most tumors. B. The percent change in tumor volume on day 10 when treatment was stopped. One tumor in the vandetanib group was too small to show up on the scale used. The numbers above the corresponding bar plots show the area under curve (AUC) values, used to statistically compare selpercatinib and vandetanib treatments to the vehicle group. The resulting AUC values were used to calculate the p-values displayed. C. Animals (three) in the selpercatinib 10 mg/kg BID group were observed for tumor recurrence after cessation of treatment. Complete responses were sustained for 42 days with no therapy. After this point, each line on the graph represents an individual tumor. D. Mice bearing SR-Sarc-0001pdx tumors were treated for two days with 10 mg/kg BID selpercatinib (three doses) or 50 mg/kg QD vandetanib (two doses) and the tumors removed to profile cell signaling, cell cycle, and apoptosis proteins using western blot analysis. Two tumors (T) are represented from each group. E. HMSC-RET xenograft tumors were treated with vehicle or 10 mg/kg BID selpercatinib 13 days after implantation. There were five animals per group F. The percent change in tumor volume on day 10 when treatment was stopped. The numbers above the corresponding bar plots show the AUC values, used to statistically compare the two conditions and calculate the p-value for the 10 mg/kg BID selpercatinib group. G. Histology of HMSC-RET xenograft tumors isolated at the end of the study. The selpercatinib-treated tumors were composed of hypocellular stroma, consistent with necrotic scarring.

