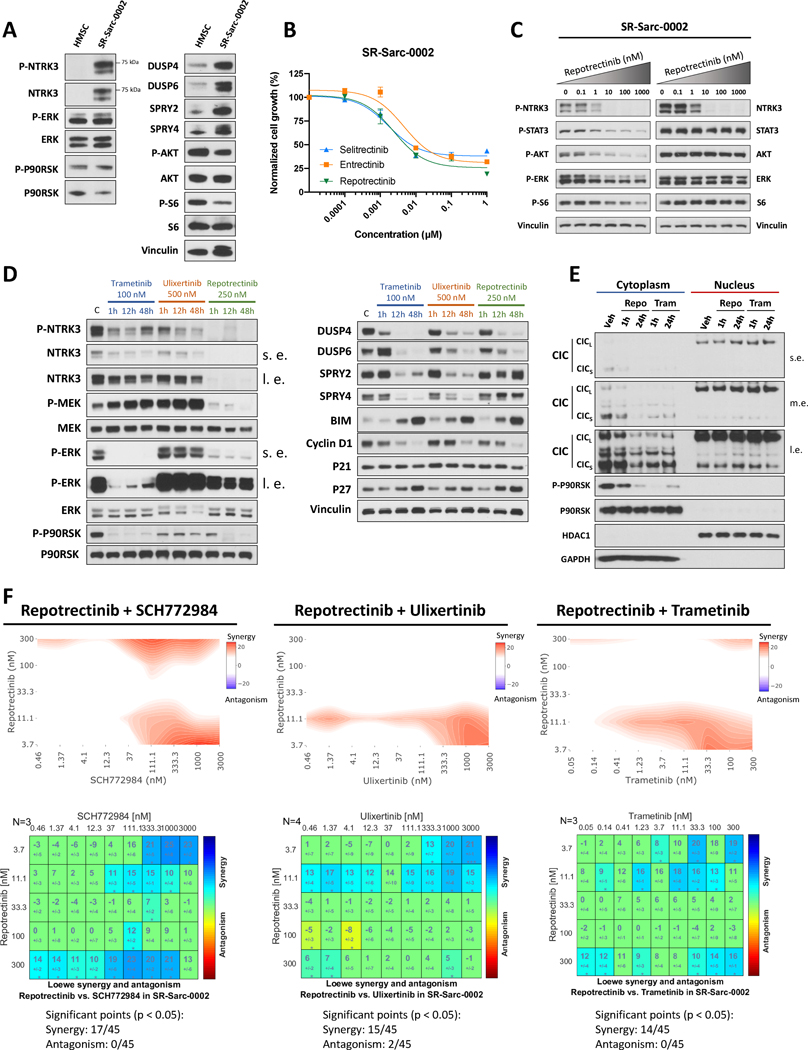
Figure 8. ETV6-NTRK3-rearranged sarcoma model confirms a broad role of MAPK regulation in RTK oncogenesis and response to therapy.
A. HMSC and SR-Sarc-0002 (ETV6-NTRK3F617I rearranged infantile fibrosarcoma cell line) cells were serum-starved for 24 h and then whole-cell extracts were prepared for western blot profiling. Data represents the mean ± SD of three measurements. B. SR-Sarc-0002 cell were treated with the indicated doses of repotrectinib (TPX-0005), entrectinib, and selitrectinib (LOXO-195) for 96 h and then cell viability was assessed using alamarBlue. C. SR-Sarc-0002 cells were treated with the indicated doses of repotrectinib for 90 min and then whole-cell extracts were prepared for western blot profiling. D. SR-Sarc-0002 cells were treated with trametinib (100 nM), ulixertinib (500 nM), or repotrectinib (250 nM) for the indicated times and then whole-cell extracts prepared for western blotting. s.e.: shorter exposure, l.e.: longer exposure. E. SR-Sarc-0002 cells were treated with repotrectinib (250 nM) or trametinib (100 nM) for 1 and 24 h and nuclear and cytoplasmic extracts were prepared for western blotting. Repo – repotrectinib 250 nM, Tram – trametinib 100 nM, s.e. – short exposure, m.e. medium exposure, l.e. – long exposure. F. SR-Sarc-0002 cells were treated with the indicated combinations of repotrectinib and SCH772984 (left panel), repotrectinib and ulixertinib (middle panel), and repotrectinib and trametinib (right panel) for 96 h and then cell viability was determined. Loewe synergy analysis was applied to determine the synergy scores and their statistical significance for each combination. Resulting scores are shown as a contour map (top) or a matrix table (bottom).

