
Fig. 4. Transcriptomic program of the neutrophils recruited in IA LPS exposed lungs.
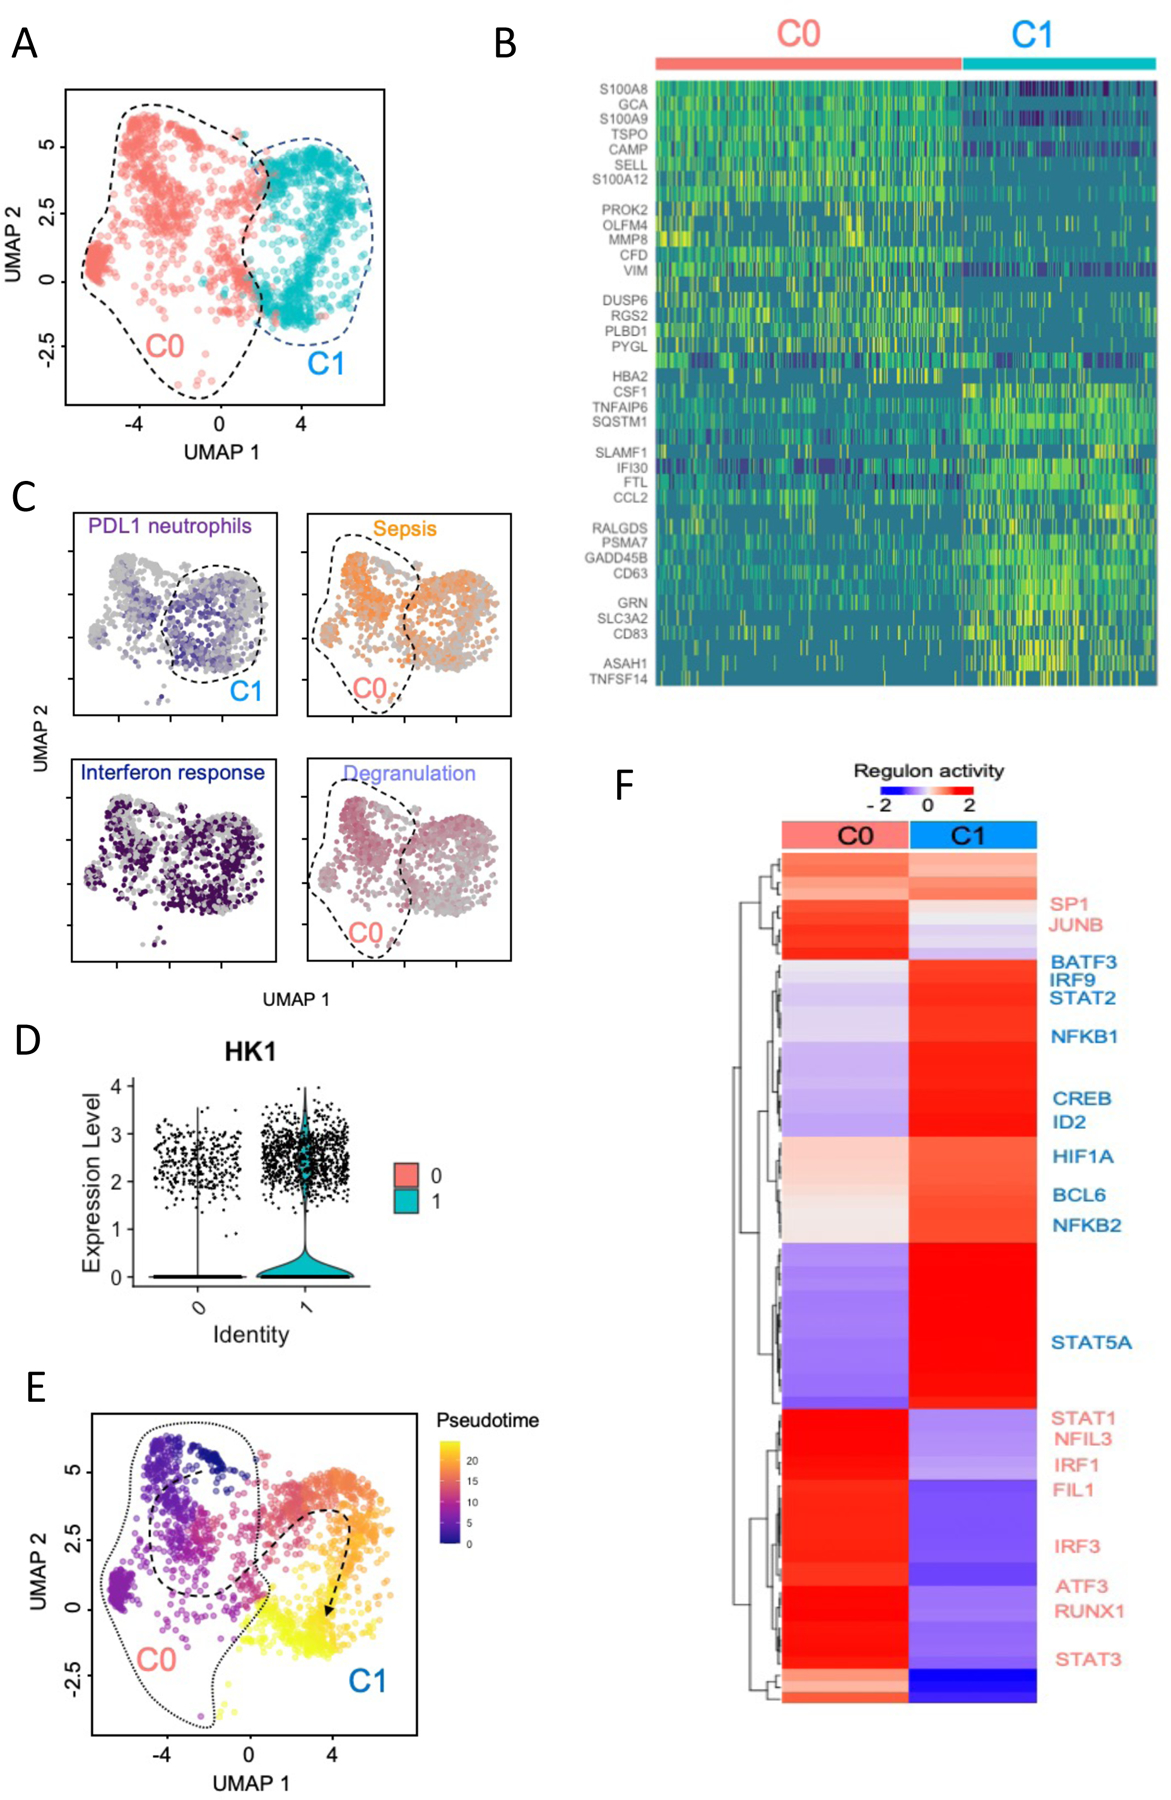
(A). UMAP embedding of neutrophils extracted from a larger dataset of lung immune cells colored by clusters. (B) Row scaled expression of the highest DEGs in each cluster (Bonferroni-adjusted p-values < 0.05). (C). UMAP embedding of neutrophils colored by average expression of genes associated with exhaustion (PD-L1, purple), sepsis (orange), interferon response (blue) and neutrophil degranulation (lavender). These gene signatures were derived from public gene expression datasets (see Methods). (D) Violin plot of HK1 expression in fetal lung neutrophils following IA LPS. (E) UMAP embedding of neutrophils colored by pseudotime with overlaid trajectory. (F) Row-scaled regulons activity for neutrophil clusters. k-means clustering was used to arrange clusters and regulons.