
Fig. 7. Fetal lung monocyte/macrophage population across treatment conditions.
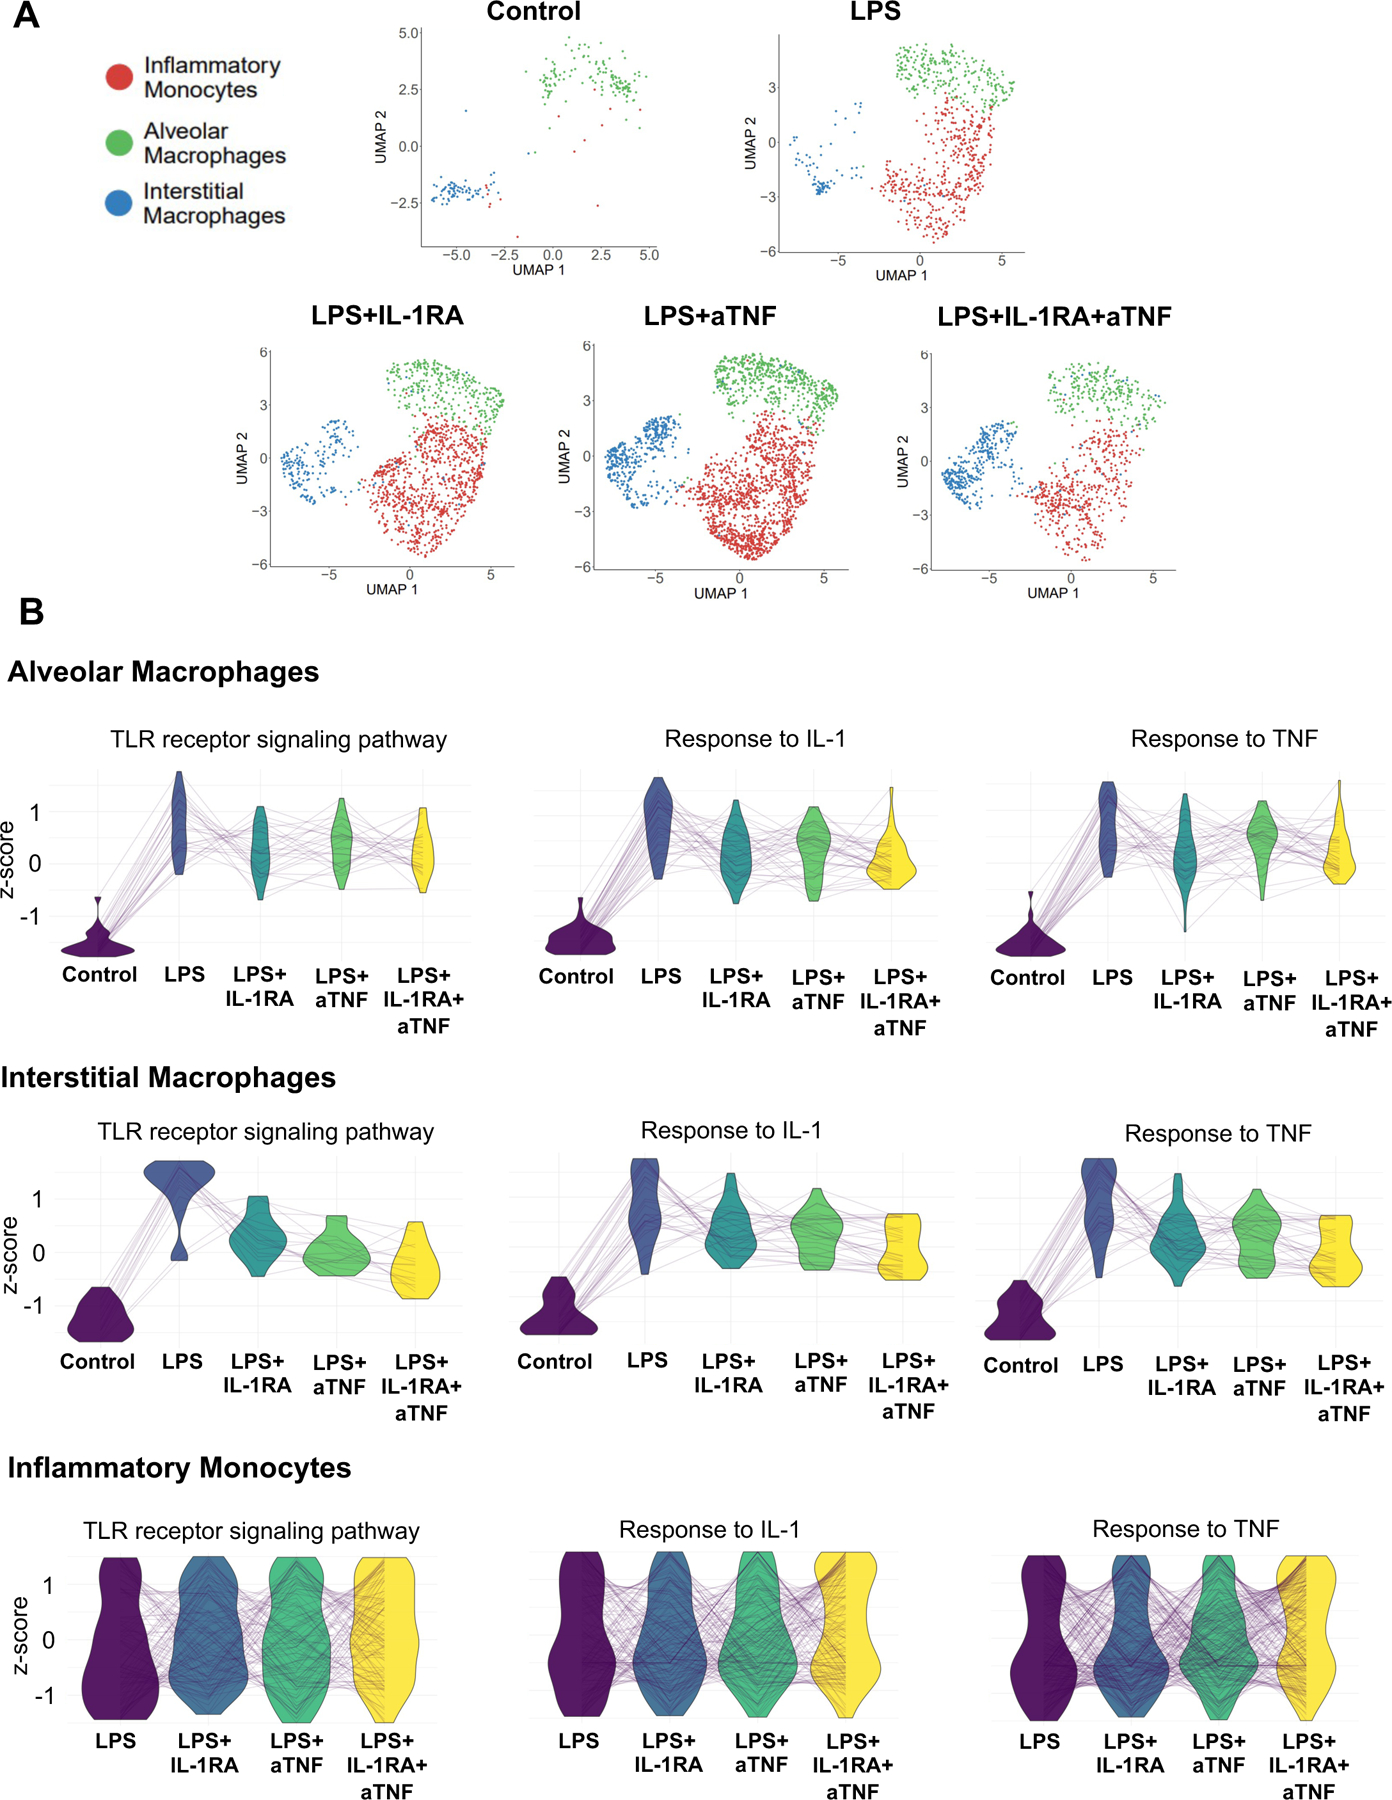
(A) UMAPs of fetal lung monocyte/macrophage populations across treatment conditions. (B) Parallel coordinate plots of scaled expression of representative genes in select biological processes across treatment conditions in alveolar, interstitial macrophages and inflammatory monocytes.