FIGURE 4.
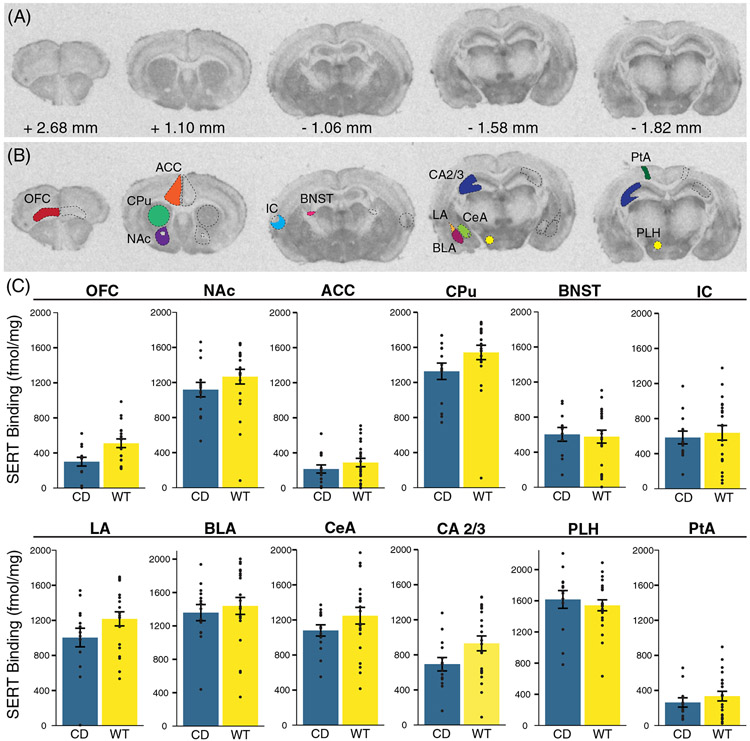
No significant differences in serotonin transporter density in Complete Deletion mice. (A) Coronal sections with corresponding distance from bregma from a representative mouse brain used in [125I]RTI-55 autoradiography analysis. (B) Example tracing of regions of interest including orbitofrontal cortex (OFC), anterior cingulate cortex (ACC), striatum (CPu), nucleus accumbens (NAc), the bed nucleus of the stria terminalis (BNST), insular cortex (IC), hippocampal CA 2 and 3 (CA 2/3) regions, basolateral (BLA), lateral (LA), and central (CeA) amygdala, lateral parietal association (PtA) and the peduncular part of the lateral hypothalamus (PLH). (C) Results of serotonin transporter (SERT) autoradiography comparing [125I]RTI-55 binding (fmol/mg protein) in regions of interest between CD mice and WT mice. Colored bars show means ± SEM (brackets). Individual measurements for each mouse (regional average) are represented by circles. For each genotype, n ≥ 5

