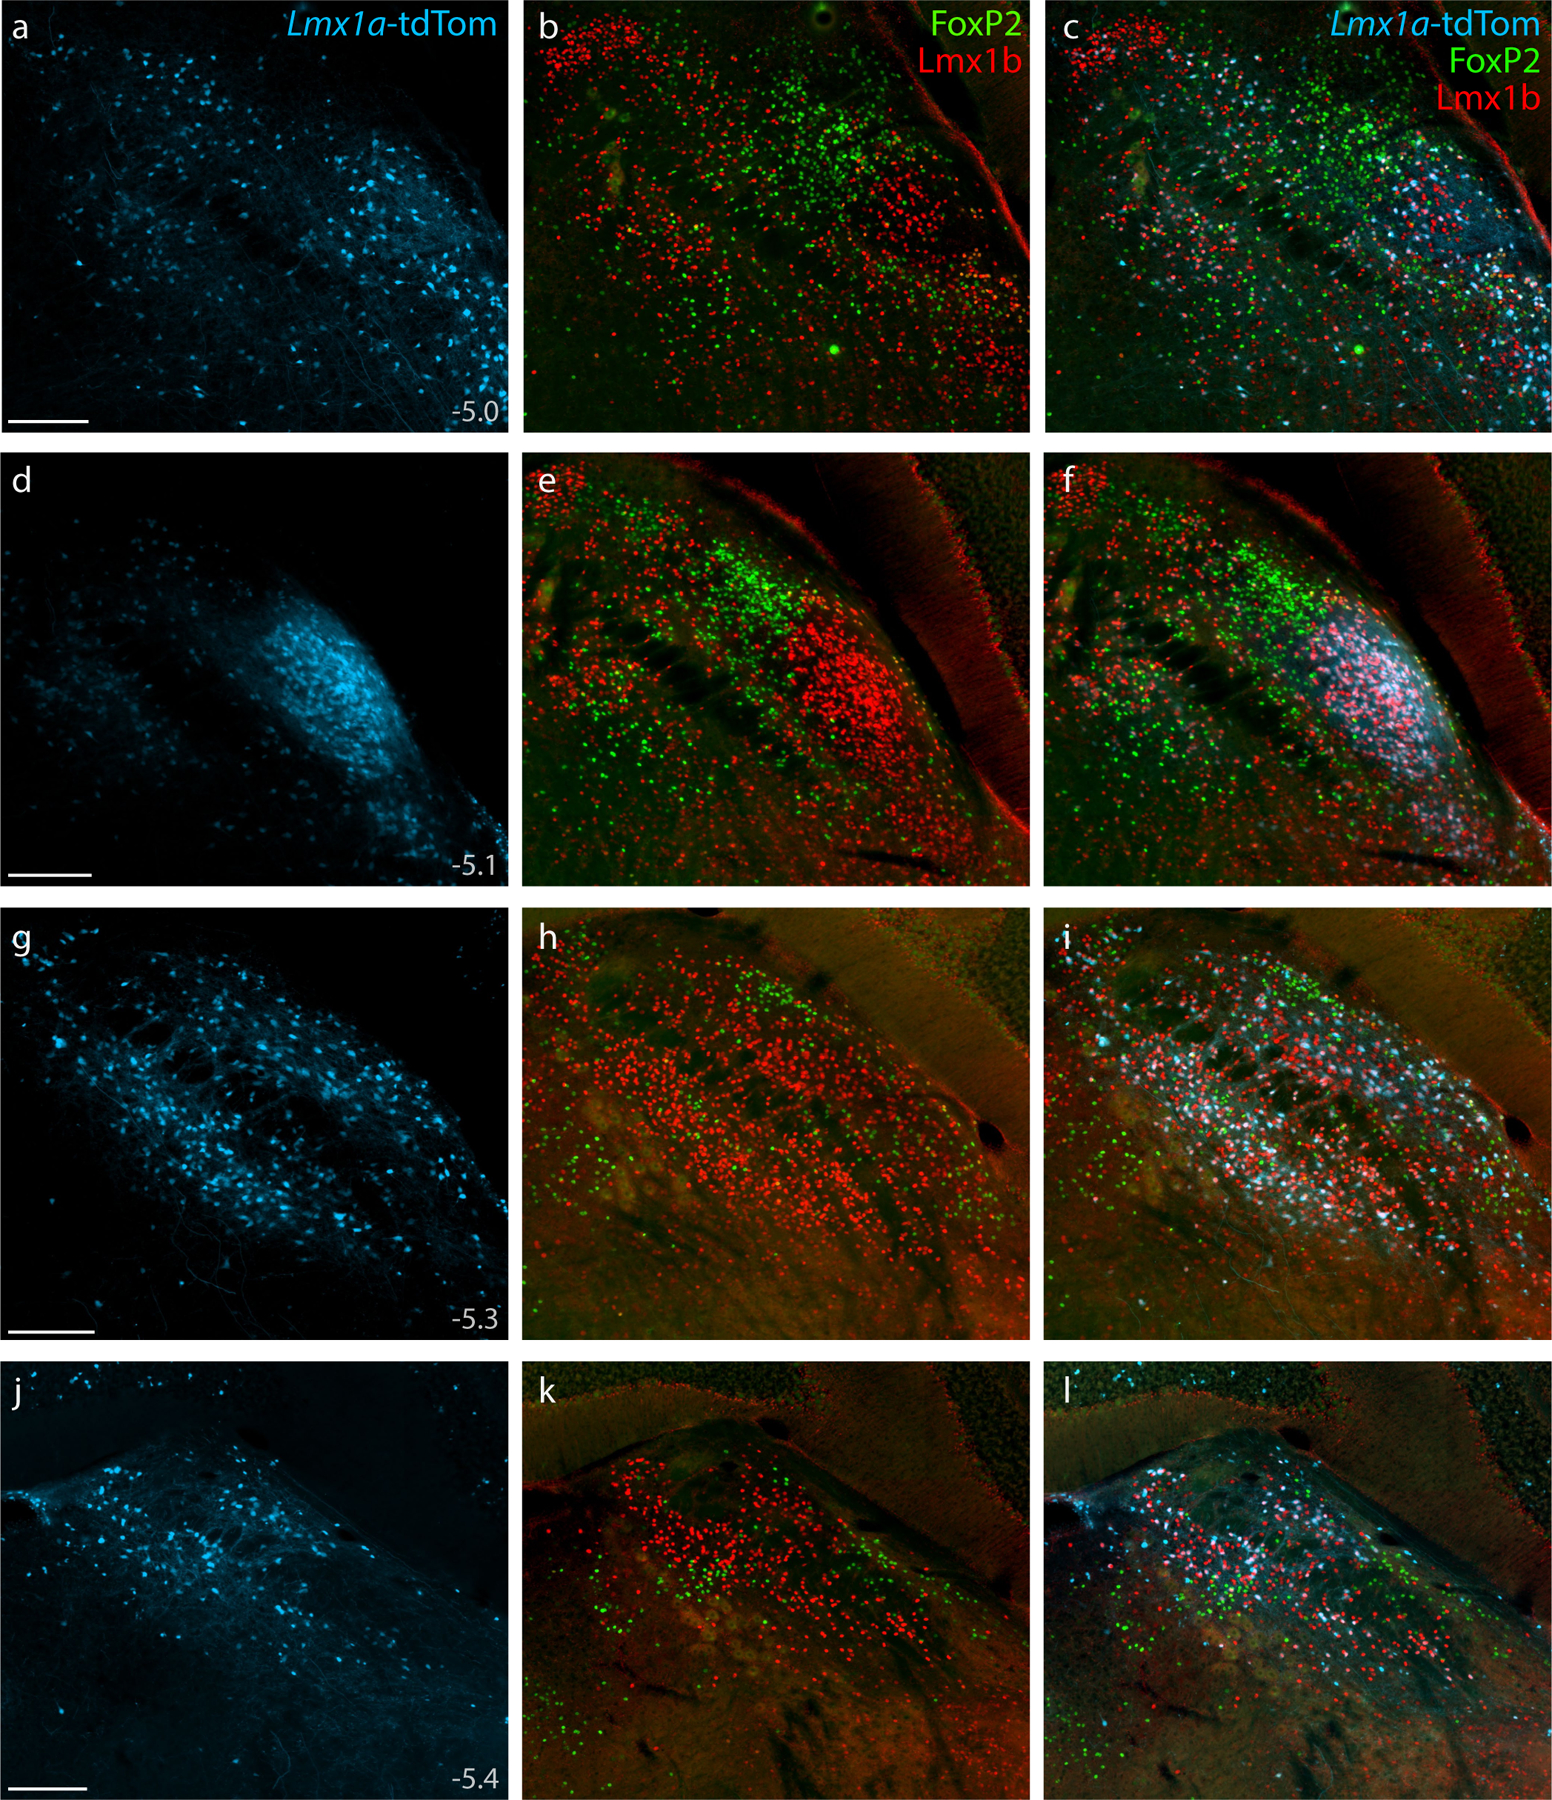
Figure 12. Lmx1a Cre fate-mapping.

Cre fate-mapping for Lmx1a (tdTomato, pseudocolored ice blue), followed by immunofluorescence labeling for Lmx1b (red) and FoxP2 (green), shown at four rostral-to-caudal levels through the PB region. Approximate level caudal to bregma is shown at bottom-left in the first panel of each row (in mm). Scale bars (a, d, g, j) are 200 μm and apply to all other panels in the same row.
