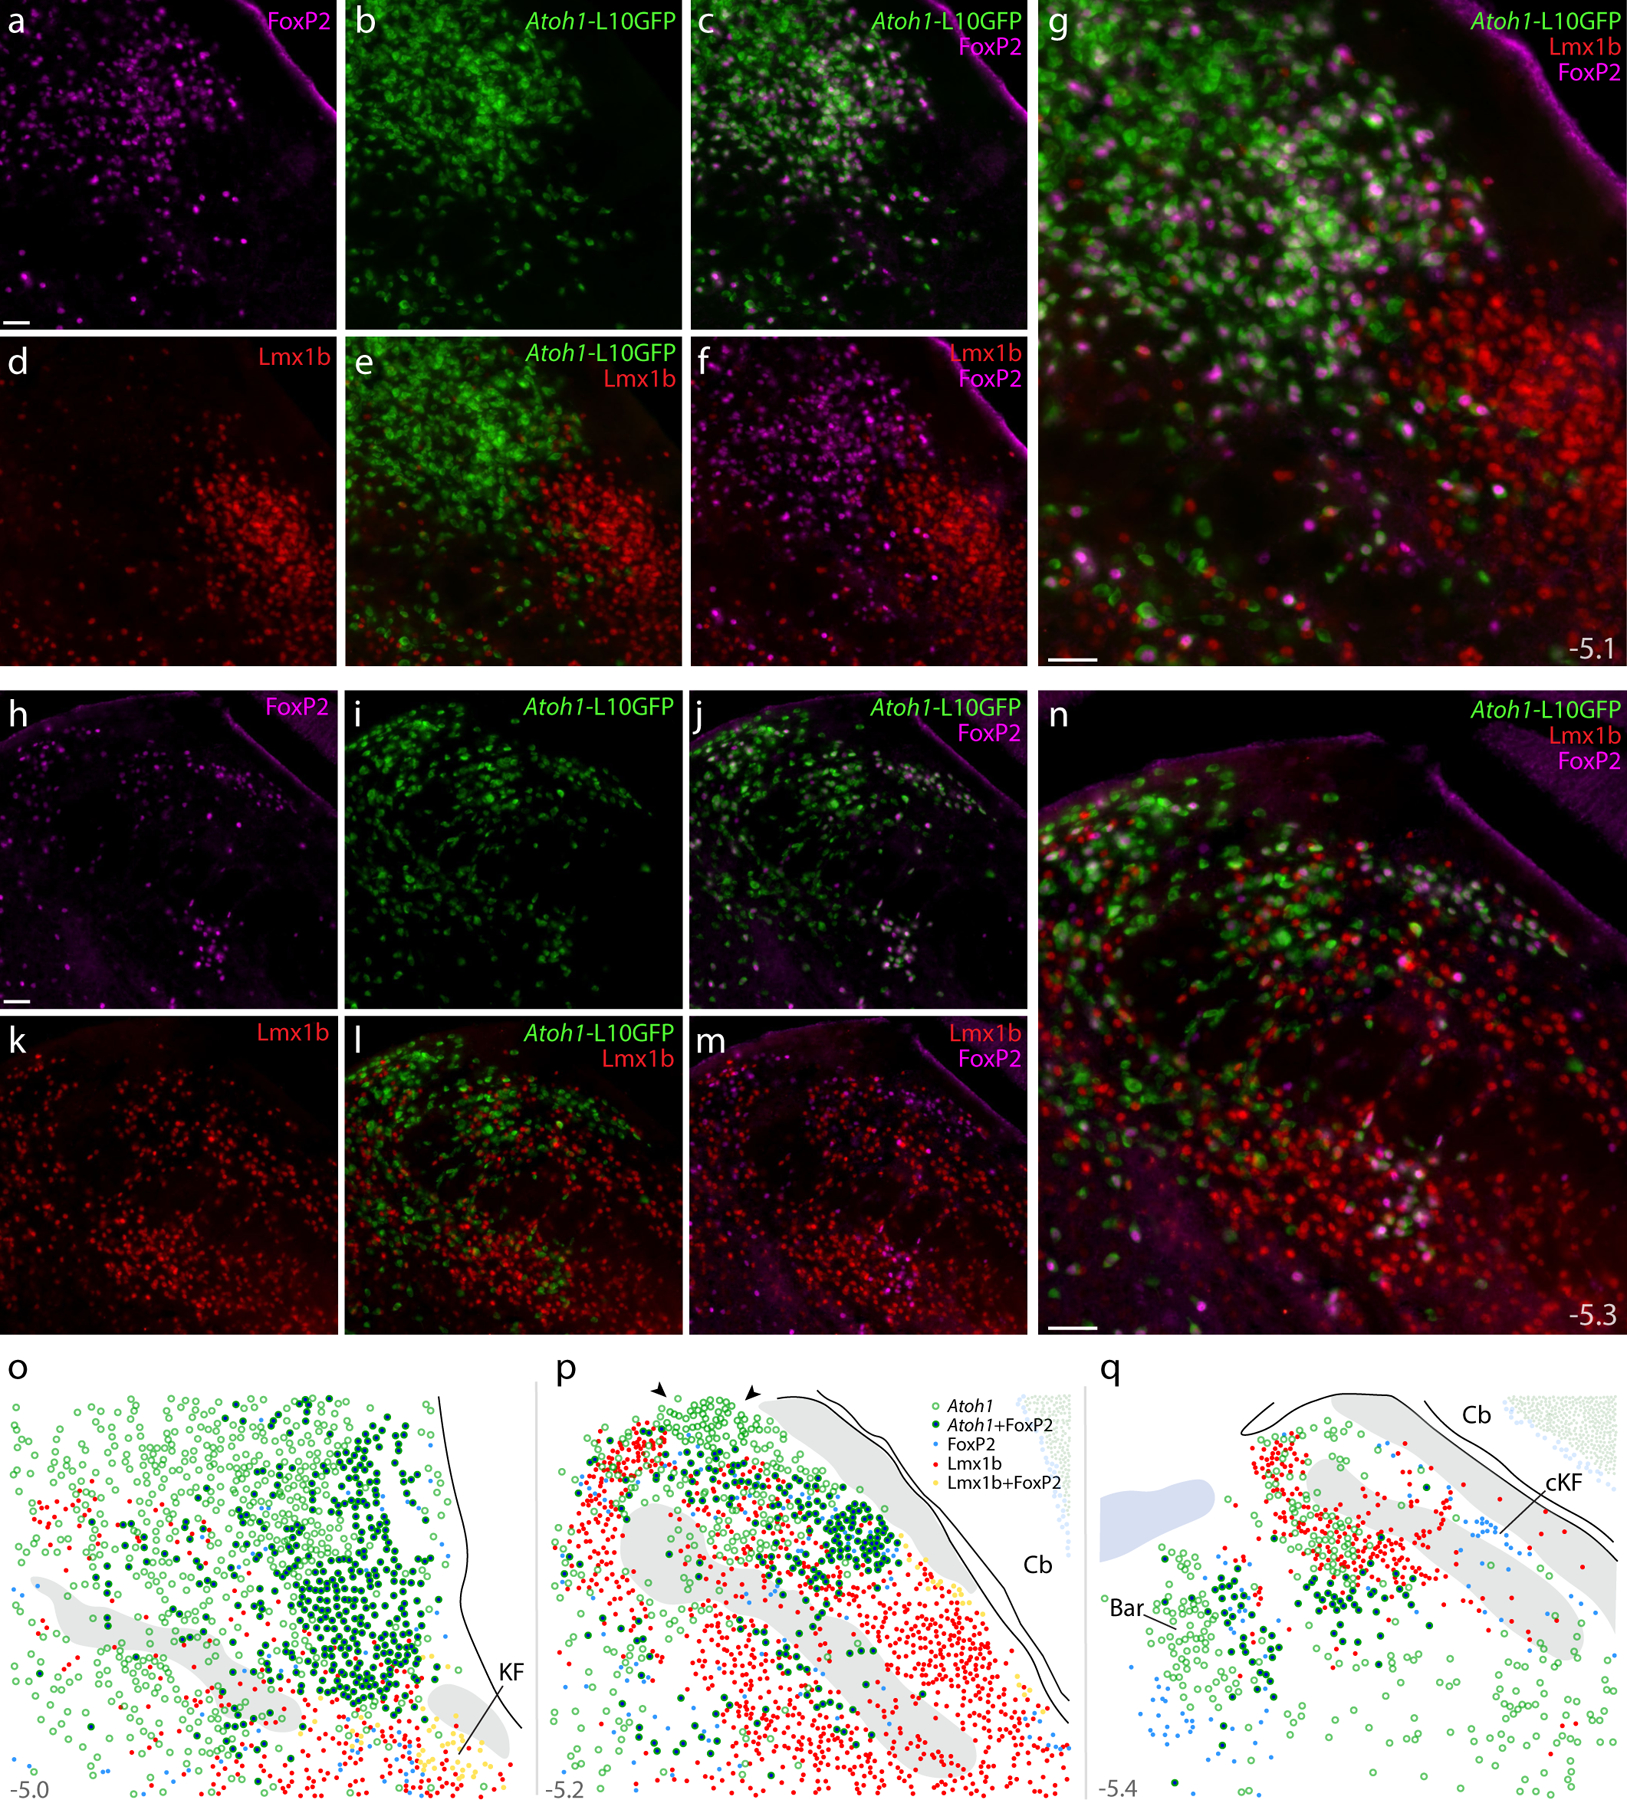
Figure 16. Atoh1 Cre fate-mapping with L10GFP: magnified color separations and plots.

Panels (a–g) show immunofluorescence labeling for FoxP2 (magenta) and Lmx1b (red) after fate-mapping for Atoh1-Cre at a mid-rostral level of the lateral PB. (h–n) Immunofluorescence labeling for FoxP2 and Lmx1b after L10GFP fate-mapping for Atoh1-Cre at a mid-caudal level of the PB, centered over the “head” and “waist” of the scp. Approximate bregma levels are shown at bottom-right in (g,n). All scale bars are 50 μm. Scale bar in (a) applied to (b-f) and scale bar in (h) applied to (i-m). (o–p) Rostral-to-caudal plots show the distribution of Atoh1-derived neurons across the PB region, including large subsets with and without FoxP2. Arrowheads in (p) highlight a dorsal cluster of L10GFP-expressing neurons that lack FoxP2. Throughout the PB, Lmx1b and L10GFP were mutually exclusive (no L10GFP-expressing PB neurons contained Lmx1b). Approximate bregma levels are shown at bottom-right in (g, n). Other abbreviations: cKF, “caudal KF” population.
