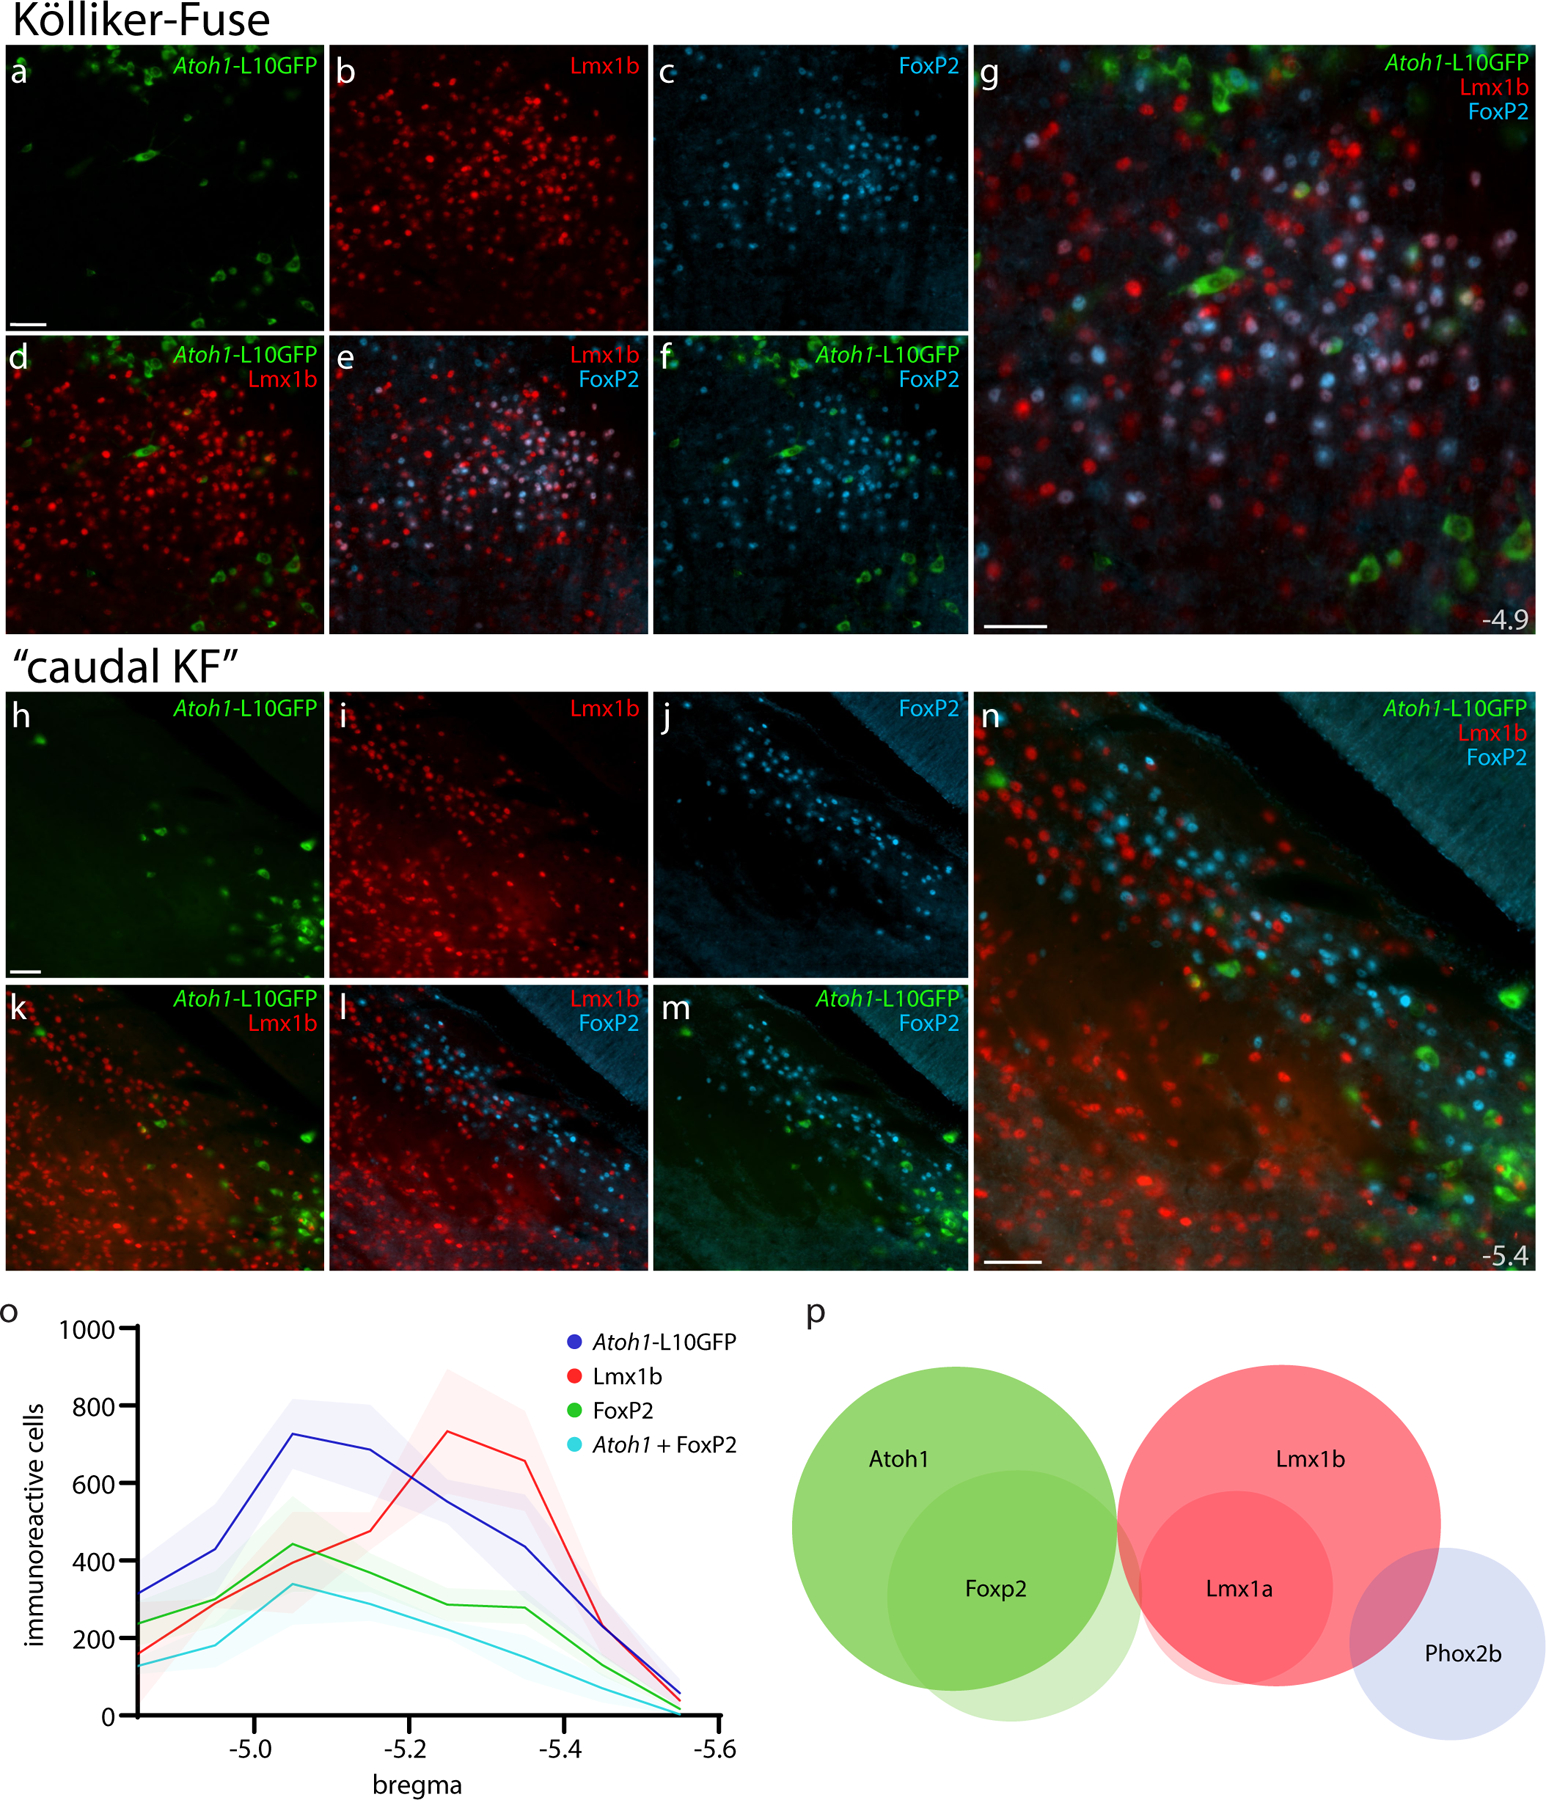
Figure 17. Cre fate-mapping for Atoh1 in KF and “caudal KF” with counts of Atoh1-derived neurons across the PB region.

Immunofluorescence labeling for Lmx1b (red) and FoxP2 (blue) after Cre fate-mapping for Atoh1 (green) in the KF region (a–g), and in the “caudal KF” (h–n). Approximate distance from bregma is shown at bottom-right in (g, n). All scale bars are 50 μm. Scale bar in (a) also applies to (b–f). Scale bar in (h) also applies to (i–m). (o) Counts of Atoh1-derived, FoxP2, Lmx1b, and Atoh1+FoxP2 double-labeled neurons across six rostro-caudal levels. Counts were averaged at each rostrocaudal level (n=3 mice), with variance represented by a standard deviation envelope. Approximate distance caudal to bregma is shown on the x-axis. (p) Venn diagram of transcription factor markers that identify neuronal populations in the PB region.
