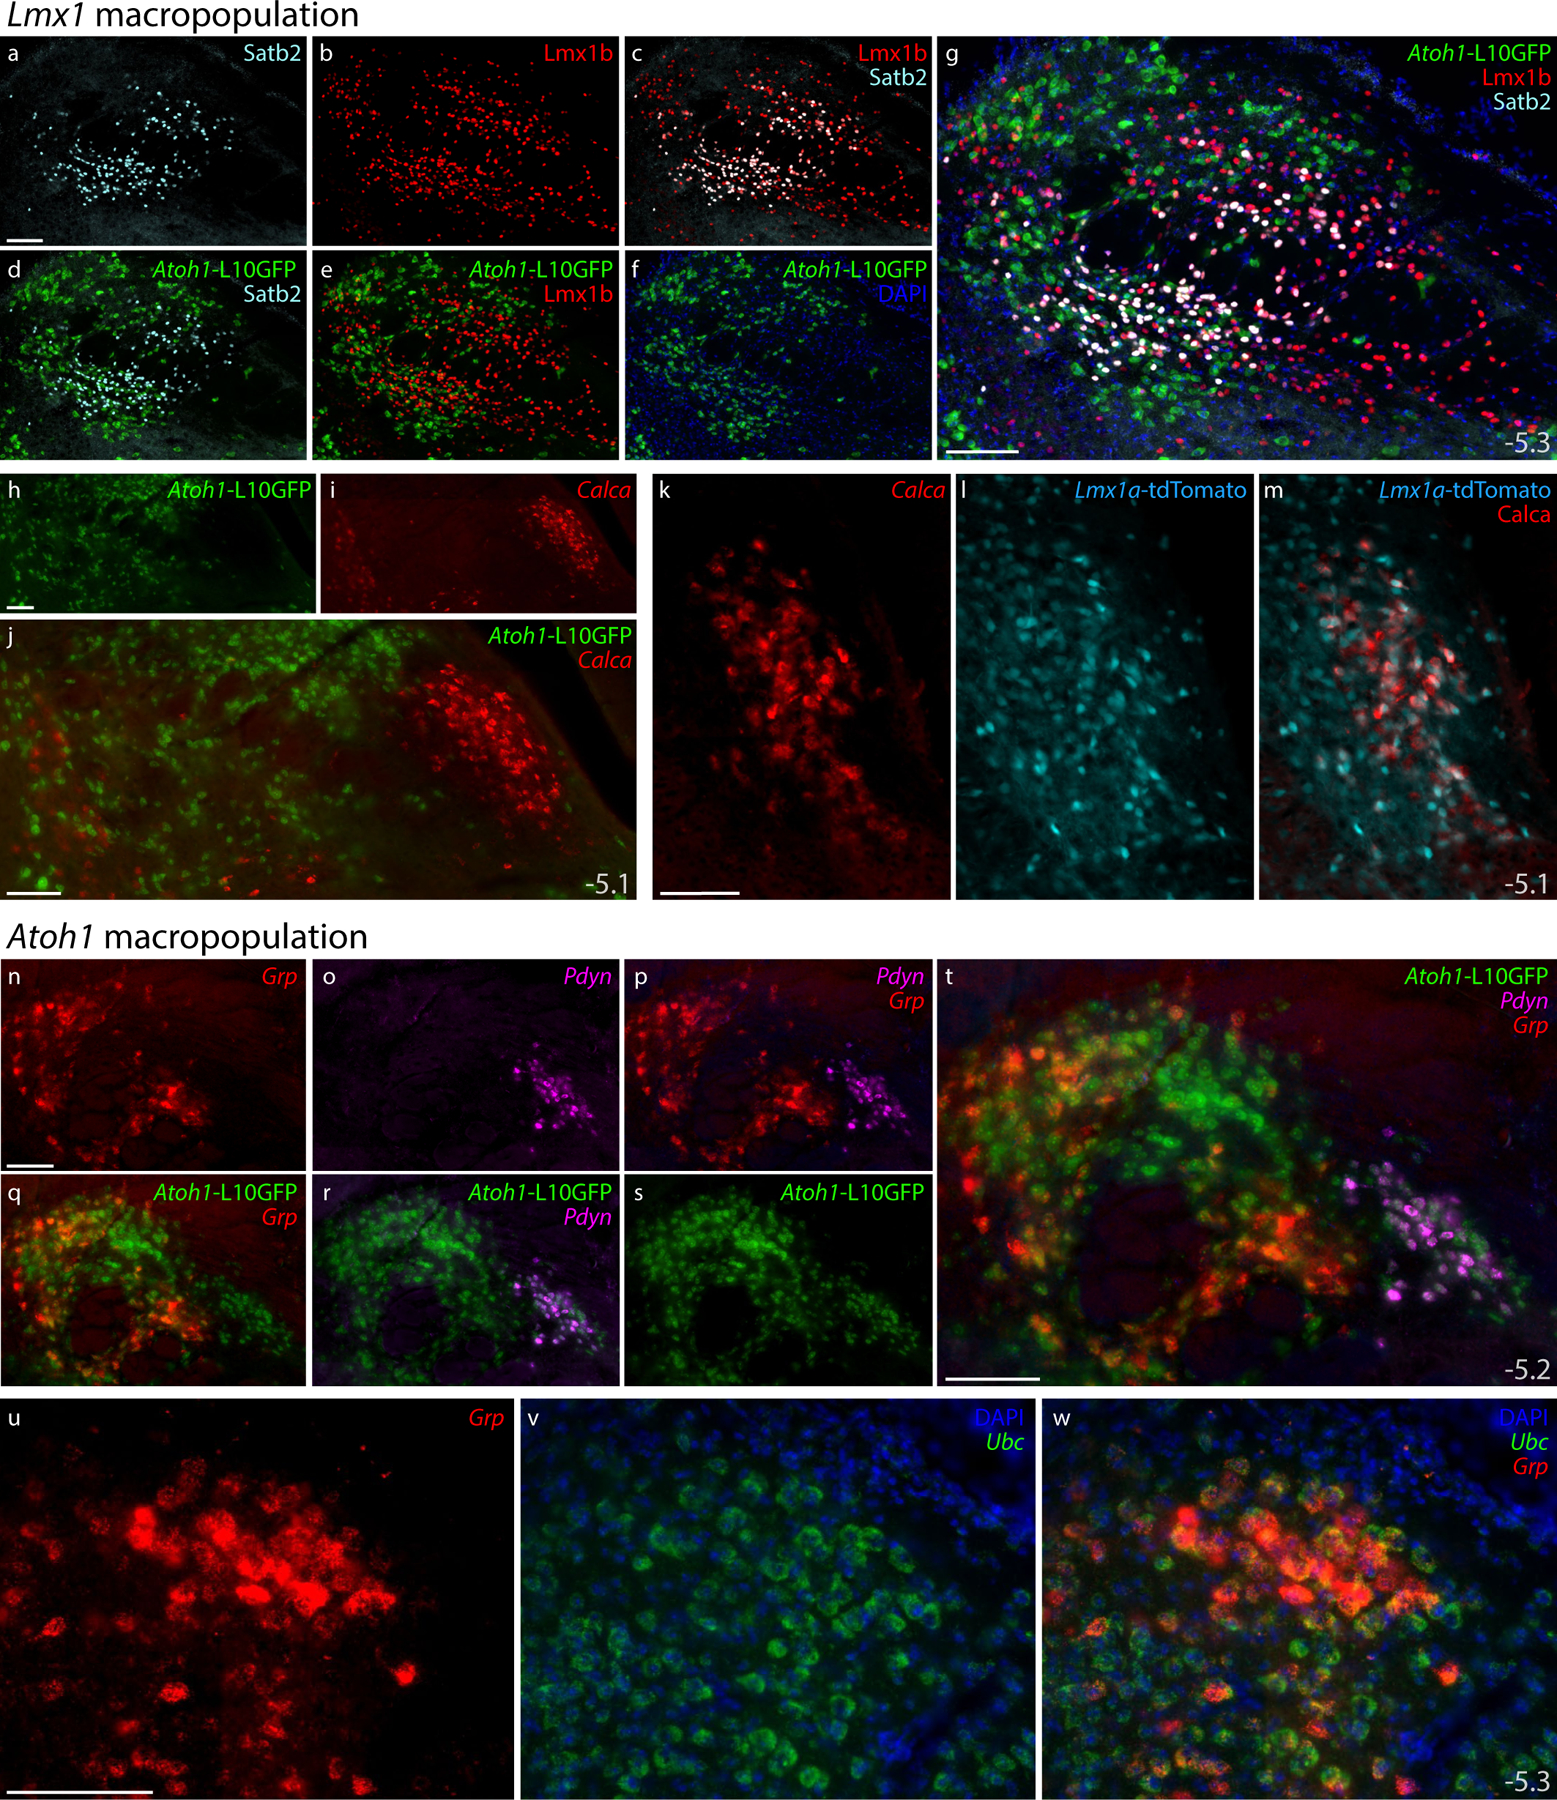
Figure 18. Subpopulations of Lmx1- and Atoh1-derived PB neurons.

Subsidiary genes define separate subpopulations within the Atoh1- and Lmx1-derived PB macropopulations. (a–g) Immunofluorescence labeling for Satb2 (light blue) and Lmx1b (red) with L10GFP Cre-reporter for Atoh1 (green) at a mid-caudal level of the PB. (h–j) FISH labeling for Calca (red) with L10GFP Cre-reporter for Atoh1 (green) at a mid-level of the PB. (k–m) FISH labeling for Calca with tdTomato (pseudocolored ice blue) Cre-reporter for Lmx1a in PBeL. (n–t) FISH labeling for Grp mRNA (red) and Pdyn mRNA (magenta) with L10GFP Cre-reporter for Atoh1 (green) at a mid-caudal level of the PB. (u–w) FISH labeling for Grp mRNA (red) in a dorsal cluster of larger neurons that resemble the “internal lateral” subnucleus of the rat PB (Fulwiler & Saper, 1984), with Ubc mRNA (green) shown for neuroanatomical background. Approximate bregma levels shown at bottom-right in (g, j, m, t, w). All scale bars are 100 μm and apply to similar panels.
