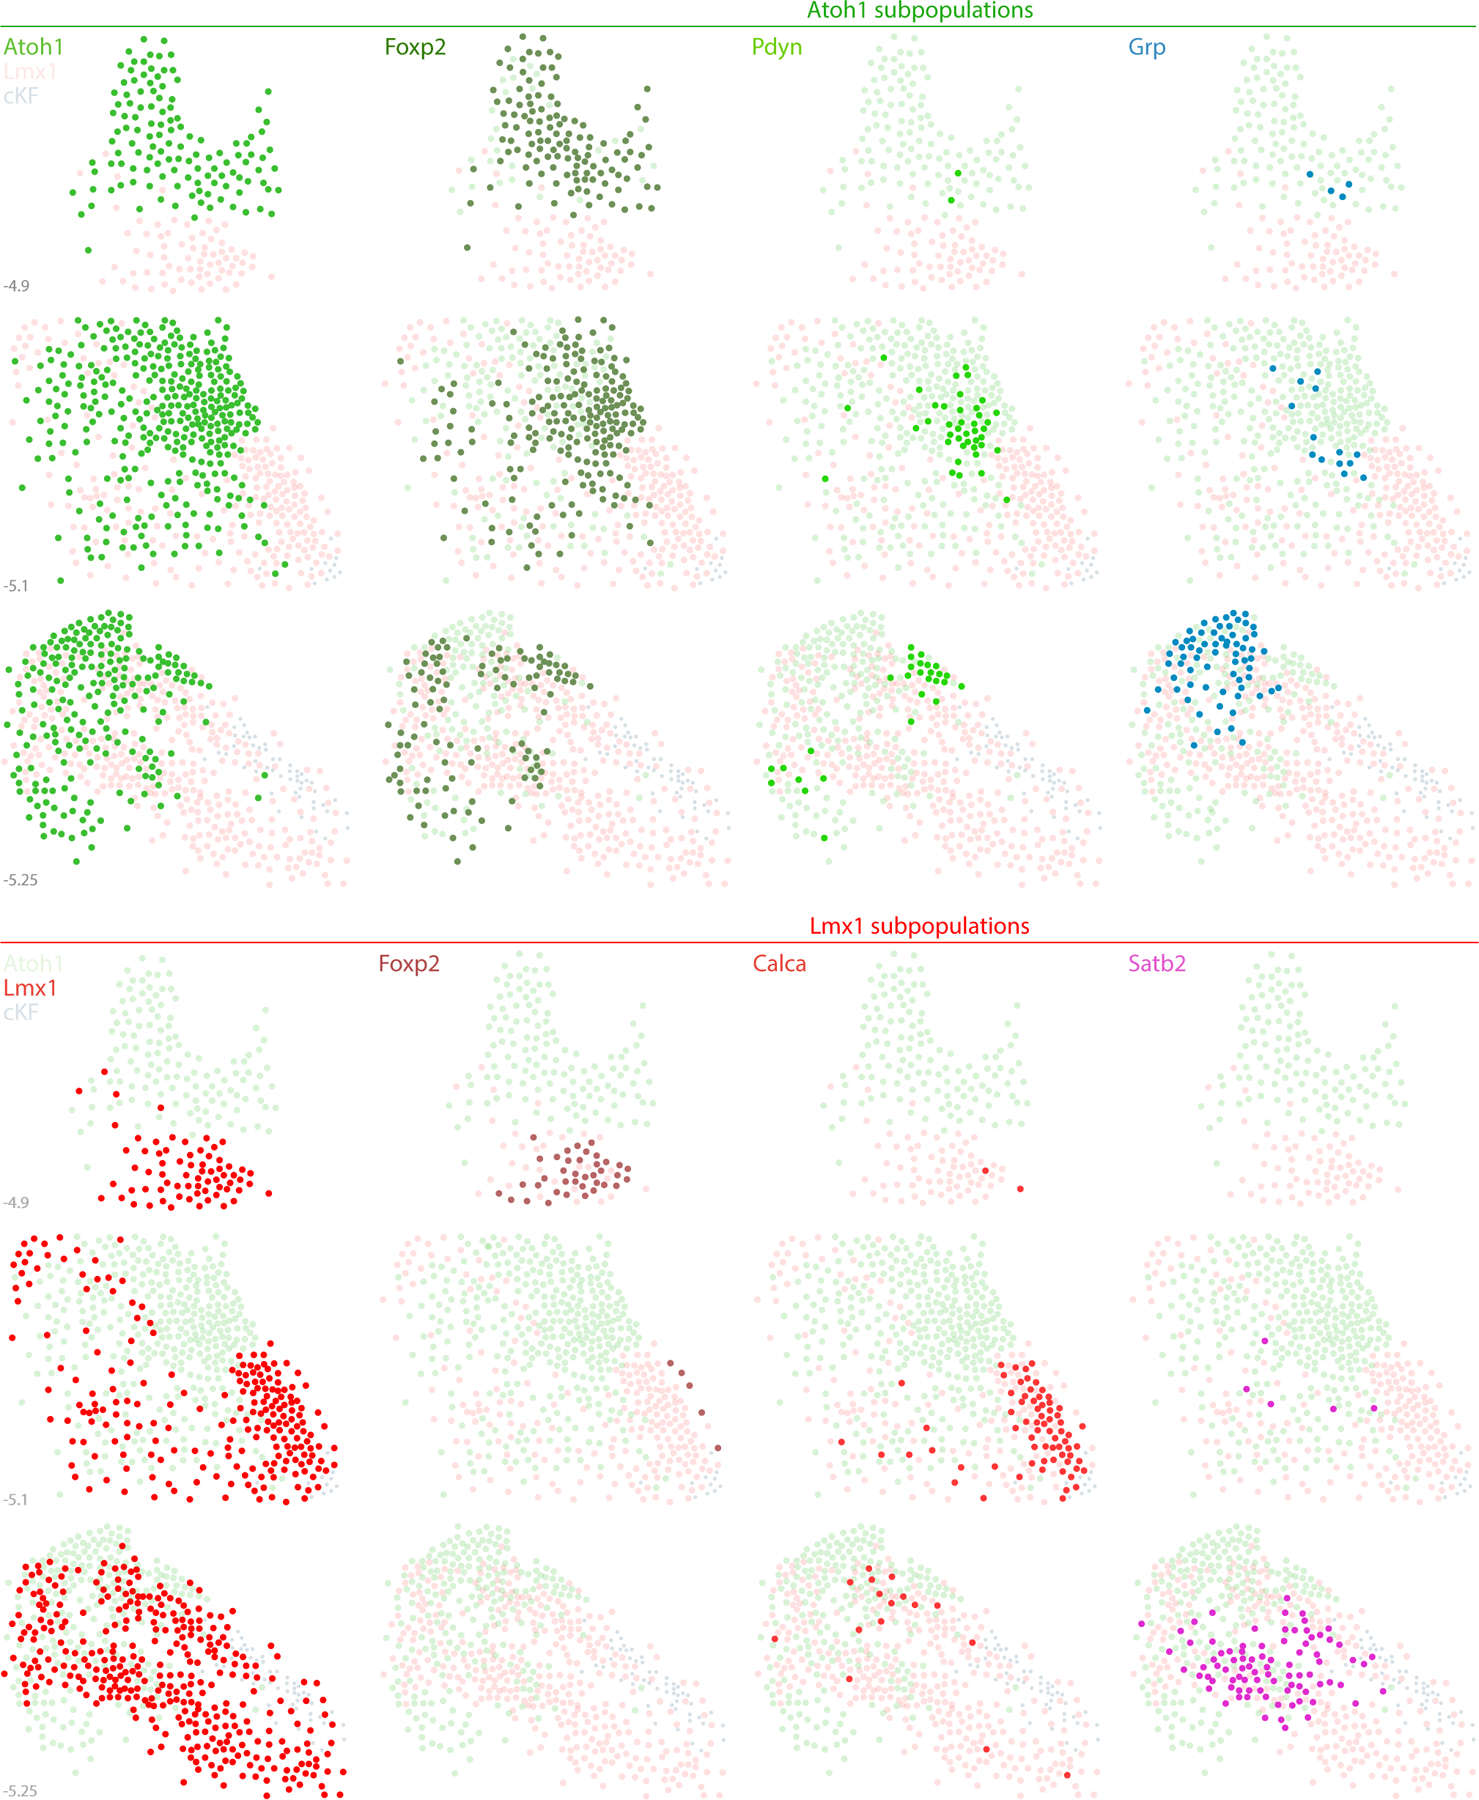
Figure 19. Distribution of Atoh1 and Lmx1 subpopulations.

The PB contains two neuronal macropopulations, which derive from embryonic precursors expressing Atoh1 (green) or Lmx1 (Lmx1b and Lmx1a; red). This figure illustrates the rostral-to-caudal distribution of subsidiary populations within each macropopulation. Some genetic markers highlight a subset of just one macropopulation, exemplified by Pdyn and Grp (Atoh1 macropopulation) and by Calca and Satb2 (Lmx1 macropopulation). In contrast, Foxp2 identifies separate subsets within each macropopulation. Foxp2 is expressed by an extensive subset of Atoh1-derived neurons (dark-green dots) and by a more restricted, ventral subset of the Lmx1 macropopulation that is located rostrally, in the KF (dark-red dots), separate from the caudal population of GABAergic FoxP2 neurons in the “caudal KF” (cKF, light blue dots). Approximate level caudal to bregma (in mm) is shown at bottom-left for each of the three PB levels illustrated.
