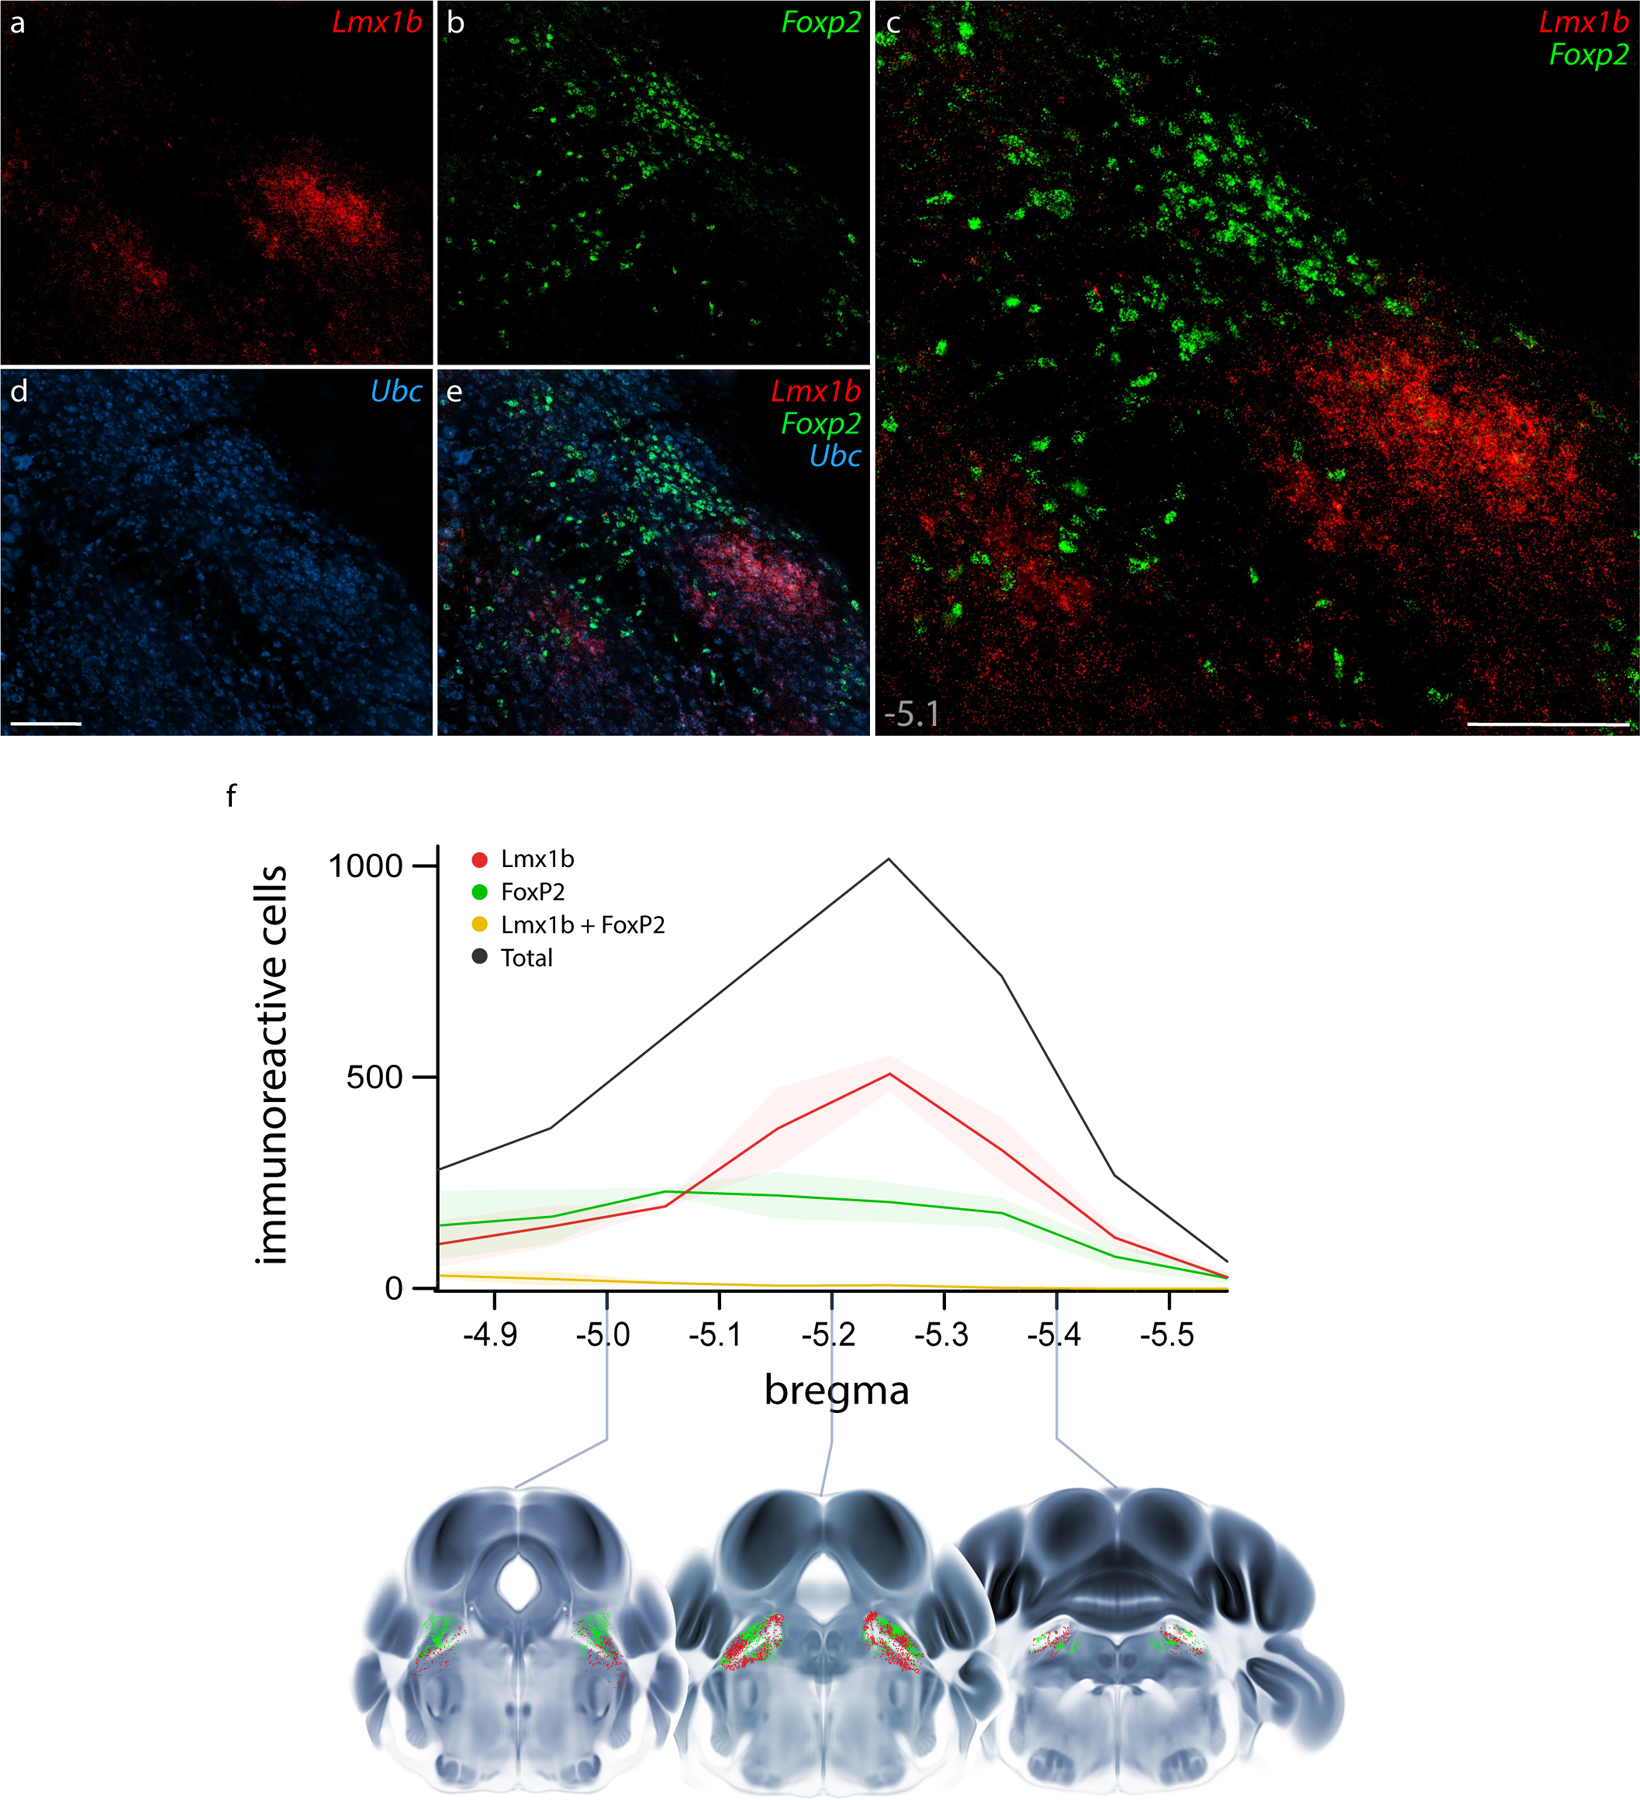
Figure 3. Fluorescence in situ hybridization (FISH) for Lmx1b and Foxp2 mRNA and rostral-to-caudal counts of PB neurons containing Lmx1b and FoxP2 protein.

Combined FISH labeling revealed the complementary expression patterns of Lmx1b mRNA (a, red) and Foxp2 mRNA (b, green) at a mid-level of the mouse PB (approximately bregma −5.1 mm). The ubiquitously expressed transcript Ubc (d, blue) was labeled for neuroanatomical background. Scale bars in (c) and (d) are 200 μm, and the scale bar in (d) applies to remaining panels (a, b, e). (f) After immunofluorescence labeling (see examples in Figure 4), average counts of neurons containing Lmx1b and FoxP2 are shown at each level (n=3 mice), with variance represented by a standard deviation envelope. Approximate bregma levels are shown on the x-axis, with three representative plots shown atop axial images from the Allen CCFv3 atlas (Q. Wang et al., 2020).
