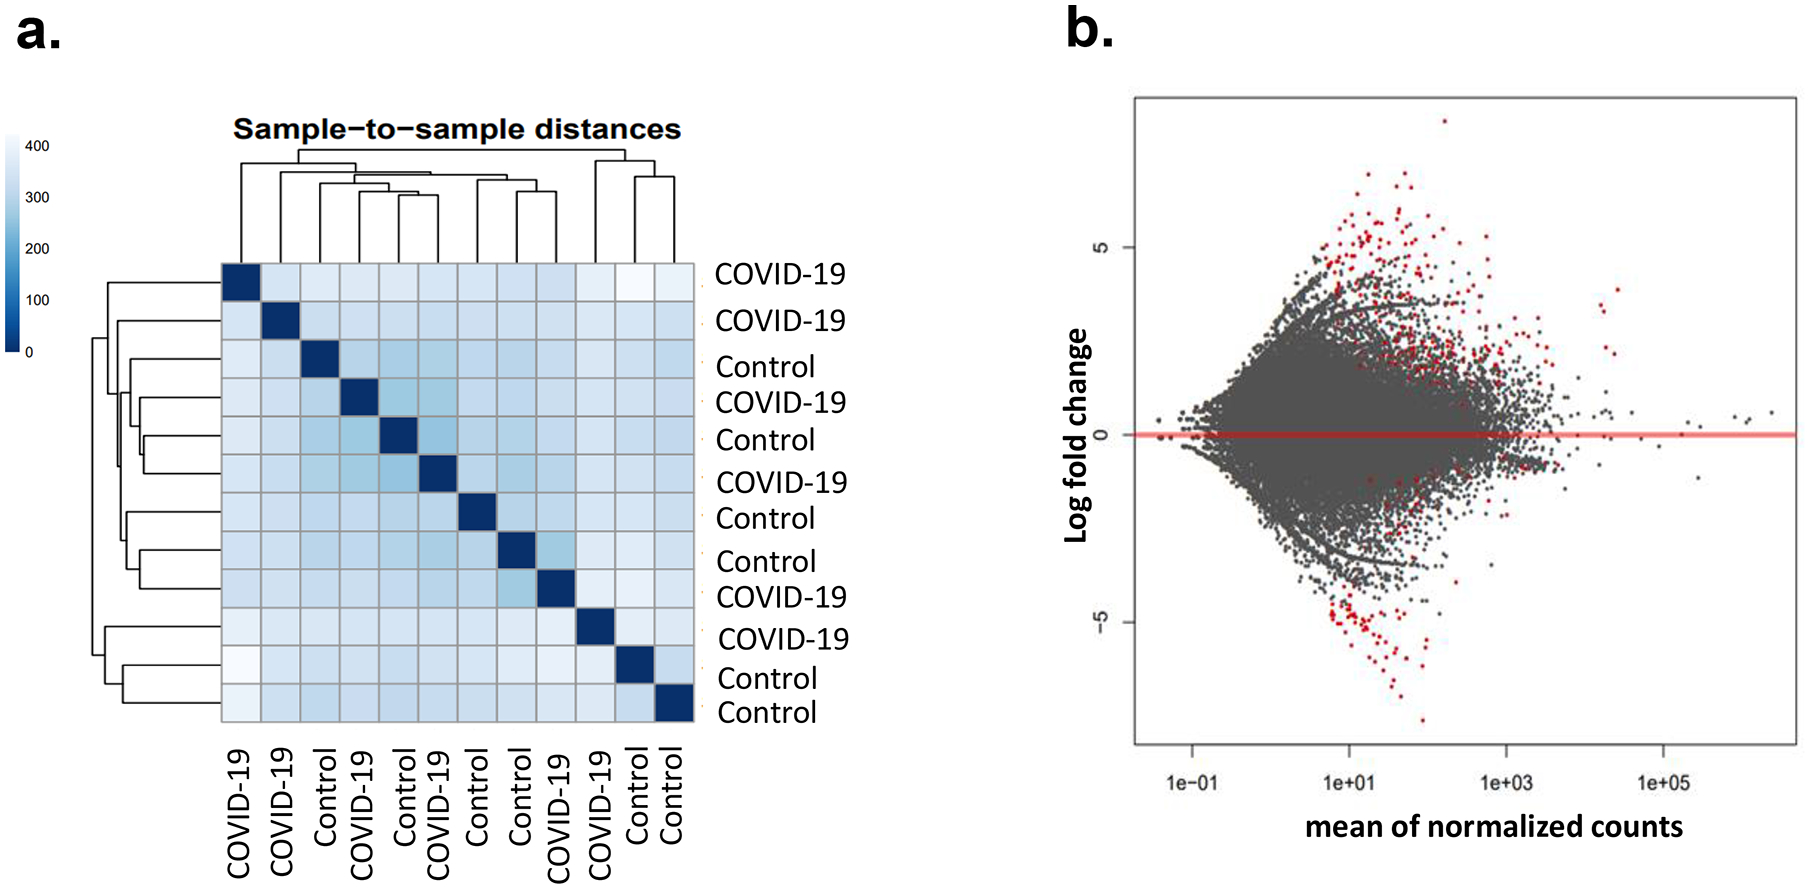
Figure 4. Gene expression profile in PBMCs of control and COVID-19 patients.

Gene expressions in 6 controls and 6 COVID-19 patients were determined by RNA-seq. The results were analyzed by DESeq2 software. Sample-to-sample distance was determined by comparing overall gene expression profile (a). Red dots are genes with significant difference in expression level between in the control and patient group (b). Adjusted p value <0.05 was considered as significant.
