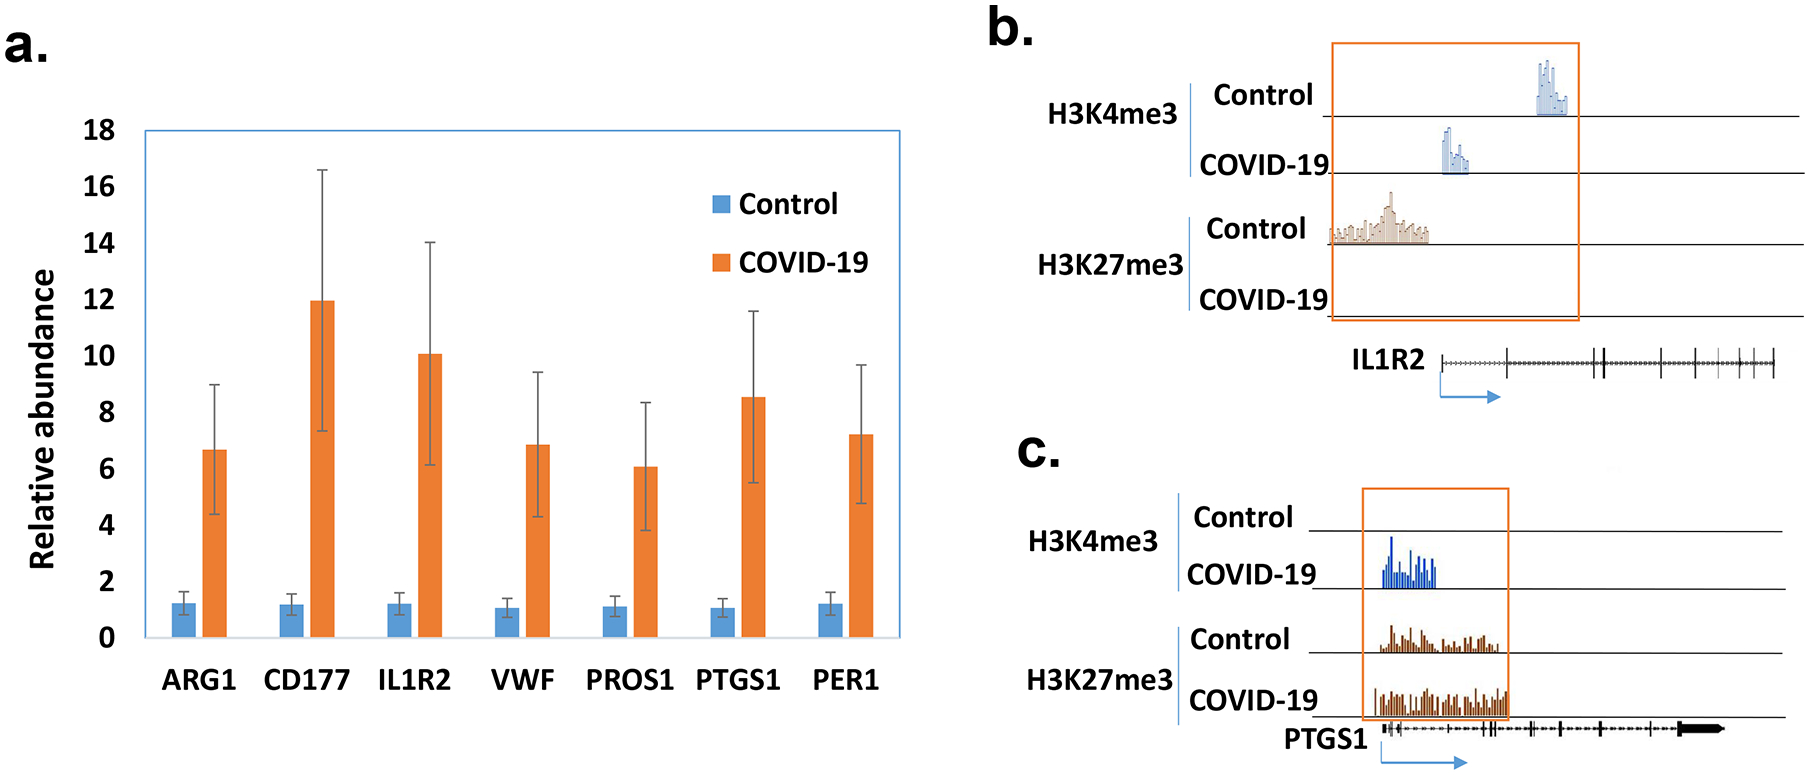
Figure 7. Expressions of selected genes in PBMCs of COVID-19 patients.

The expressions of selected genes were quantified by real time RT-PCR in PBMCs of healthy controls and patients with COVID-19 (n=5). The average amount in the controls was set as 1 and the error bars show standard error of the mean (SEM) (a). The histone marks in ILR2 (b) and PTGS1 (c) were obtained from ChIP-seq data.
