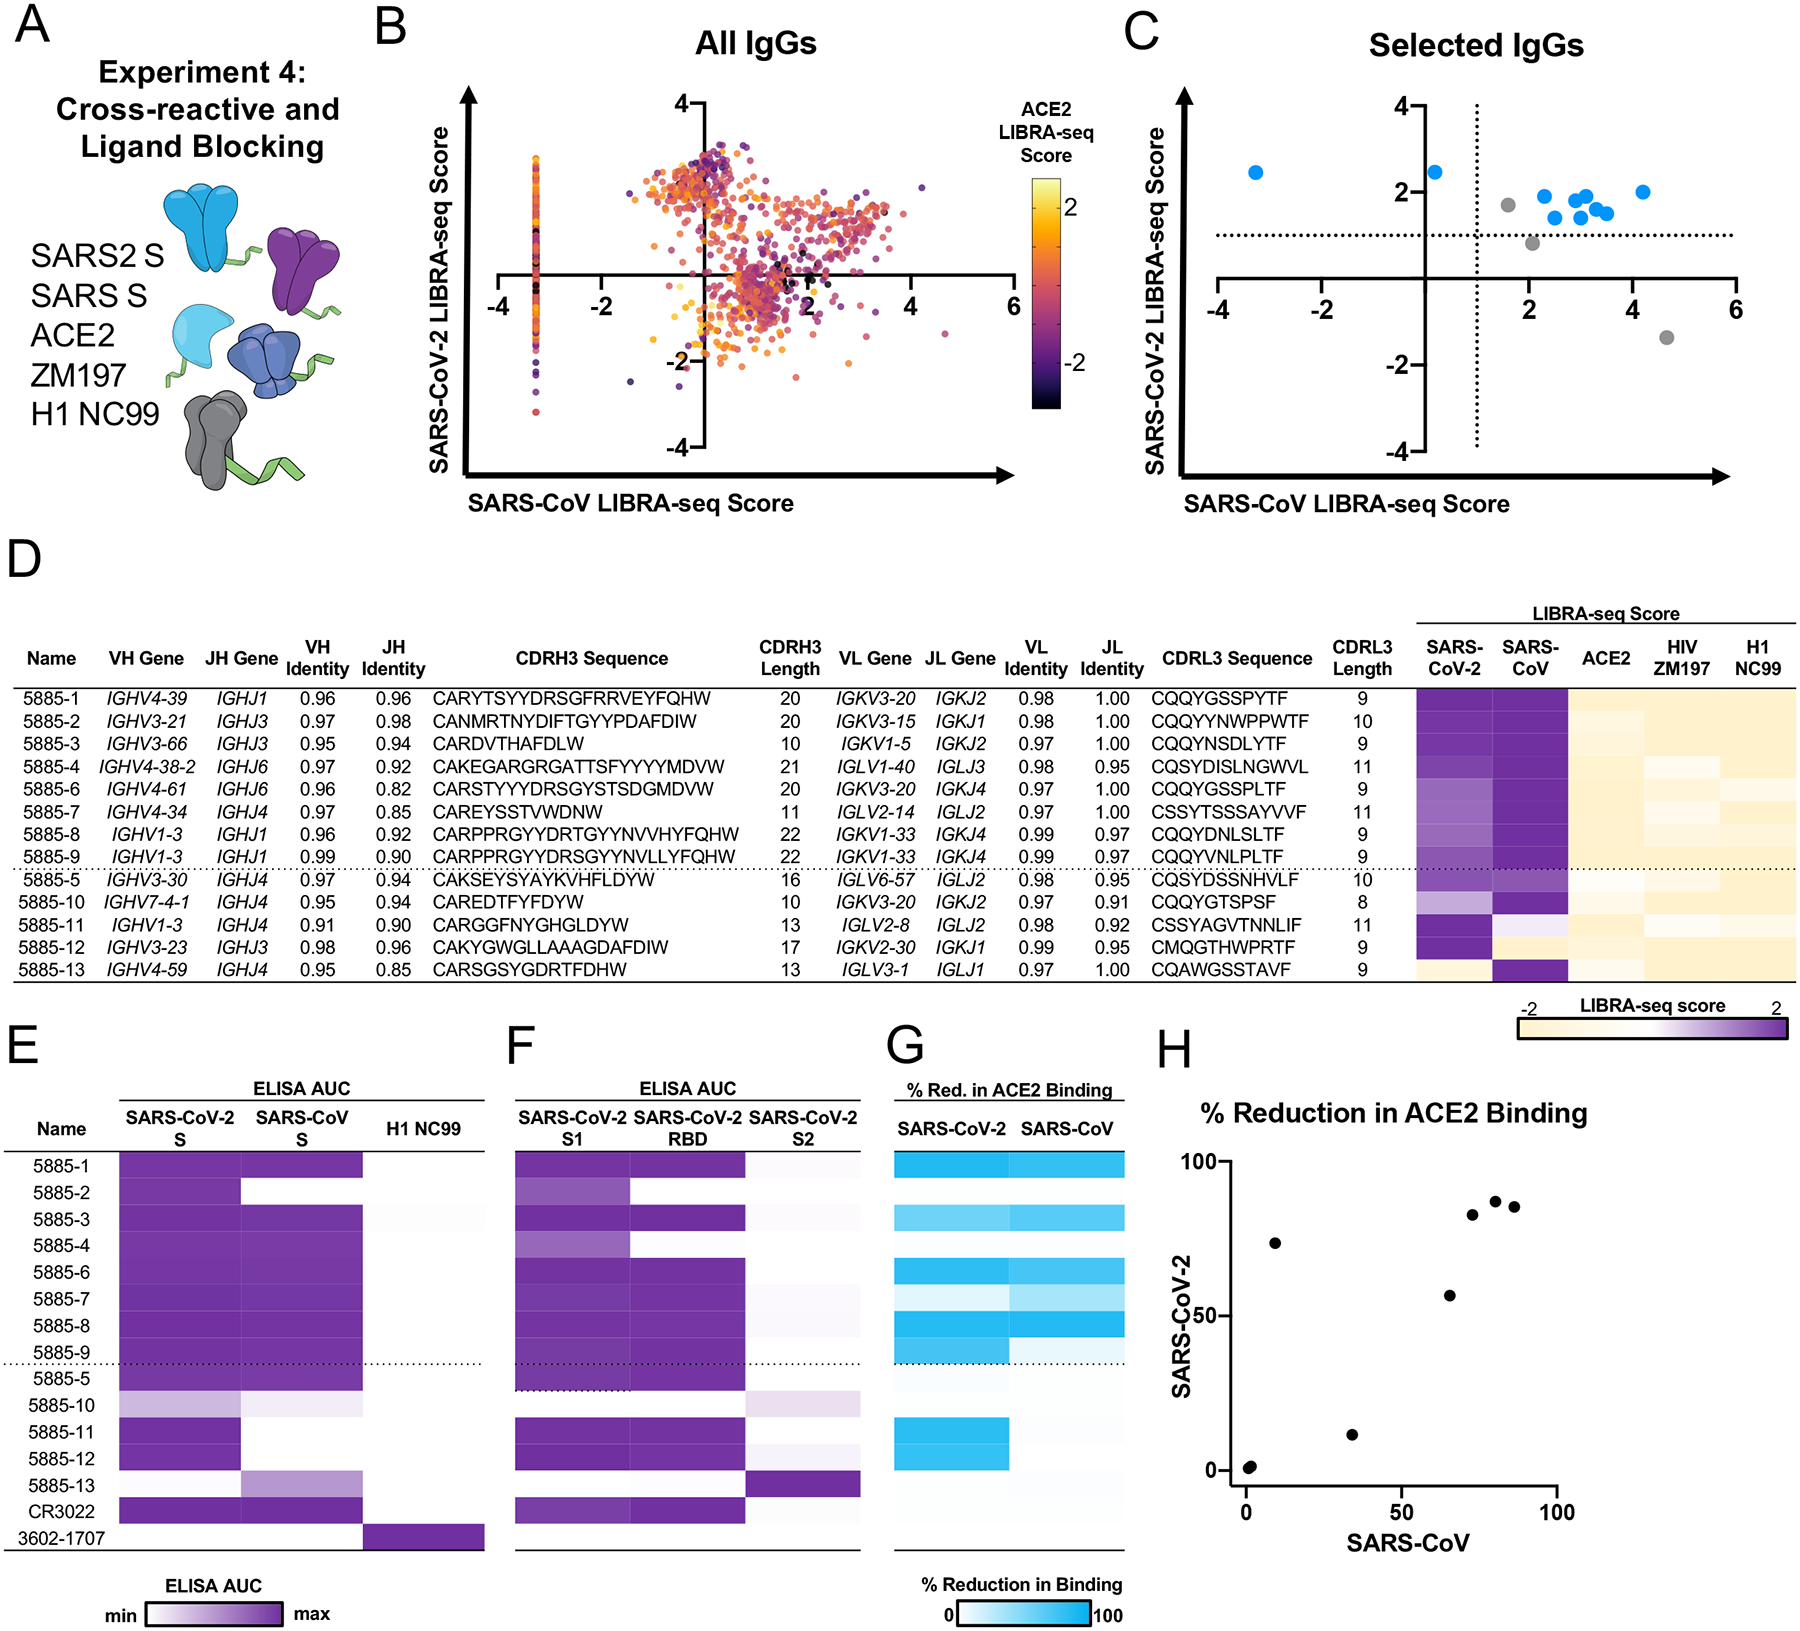
Figure 6. Discovery of cross-reactive ACE2-blocking coronavirus antibodies using LIBRA-seq with ligand blocking.

A. Schematic of LIBRA-seq with ligand blocking applied to cross-reactive antibody discovery. B. For identification of cross-reactive coronavirus antibodies with ligand blocking capability, all IgGs recovered from the LIBRA-seq experiment (n=2569) are shown, with LIBRA-seq scores for SARS-CoV (x-axis) and SARS-CoV-2 (y-axis). Each dot represents a cell, and the color of the dots shows the ACE2 LIBRA-seq score, with color heatmap shown on the right. C. Cells selected for expression and validation are shown in blue (ACE2 score <−1) or grey (ACE2 score ≥−1). Of these selected cells, 8 had high LIBRA-seq scores (>1) for SARS-CoV-2 and SARS-CoV and low scores (<−1) for ACE2. Additional candidates with a variety of scores for SARS-CoV-2, SARS-CoV and ACE2 were also selected for expression and validation as controls. D. The 8 IgGs with high LIBRA-seq scores for SARS-CoV-2 and SARS-CoV and low scores for ACE2 are shown above the dotted line. Control antibodies with other LIBRA-seq score patterns are shown below the dotted line. For each antibody, CDR sequences and lengths are shown at the amino acid level and V-gene and J-gene identity are shown at the nucleotide level. LIBRA-seq scores for antigens included in the screening library (SARS-CoV-2 spike, SARS-CoV spike, ACE2, HIV ZM197 Env, influenza hemagglutinin H1 NC99) are shown as a heatmap low (tan) – white – high (purple). Scores outside of this range are shown as the minimum and maximum values. E. ELISA area under the curve (AUC) values from binding to coronavirus spike proteins, influenza hemagglutinin H1 NC99 (negative control), and F. recombinant antigen domains, are shown as a heatmap from minimum (white) to maximum (purple) binding. G. Percent reduction in ACE2 binding by ELISA is shown for SARS-CoV-2 and SARS-CoV spikes, and displayed as a heatmap from 0% (white) to 100% (blue). H. For the 8 IgGs with high LIBRA-seq scores for SARS-CoV-2 and SARS-CoV and low scores for ACE2, the percent reduction in ACE2 binding due to antibody blocking by ELISA is shown for SARS-CoV (x-axis) and SARS-CoV-2 (y-axis).
