
Extended Data Fig. 3. Characterization of selected cross-reactive antibodies.
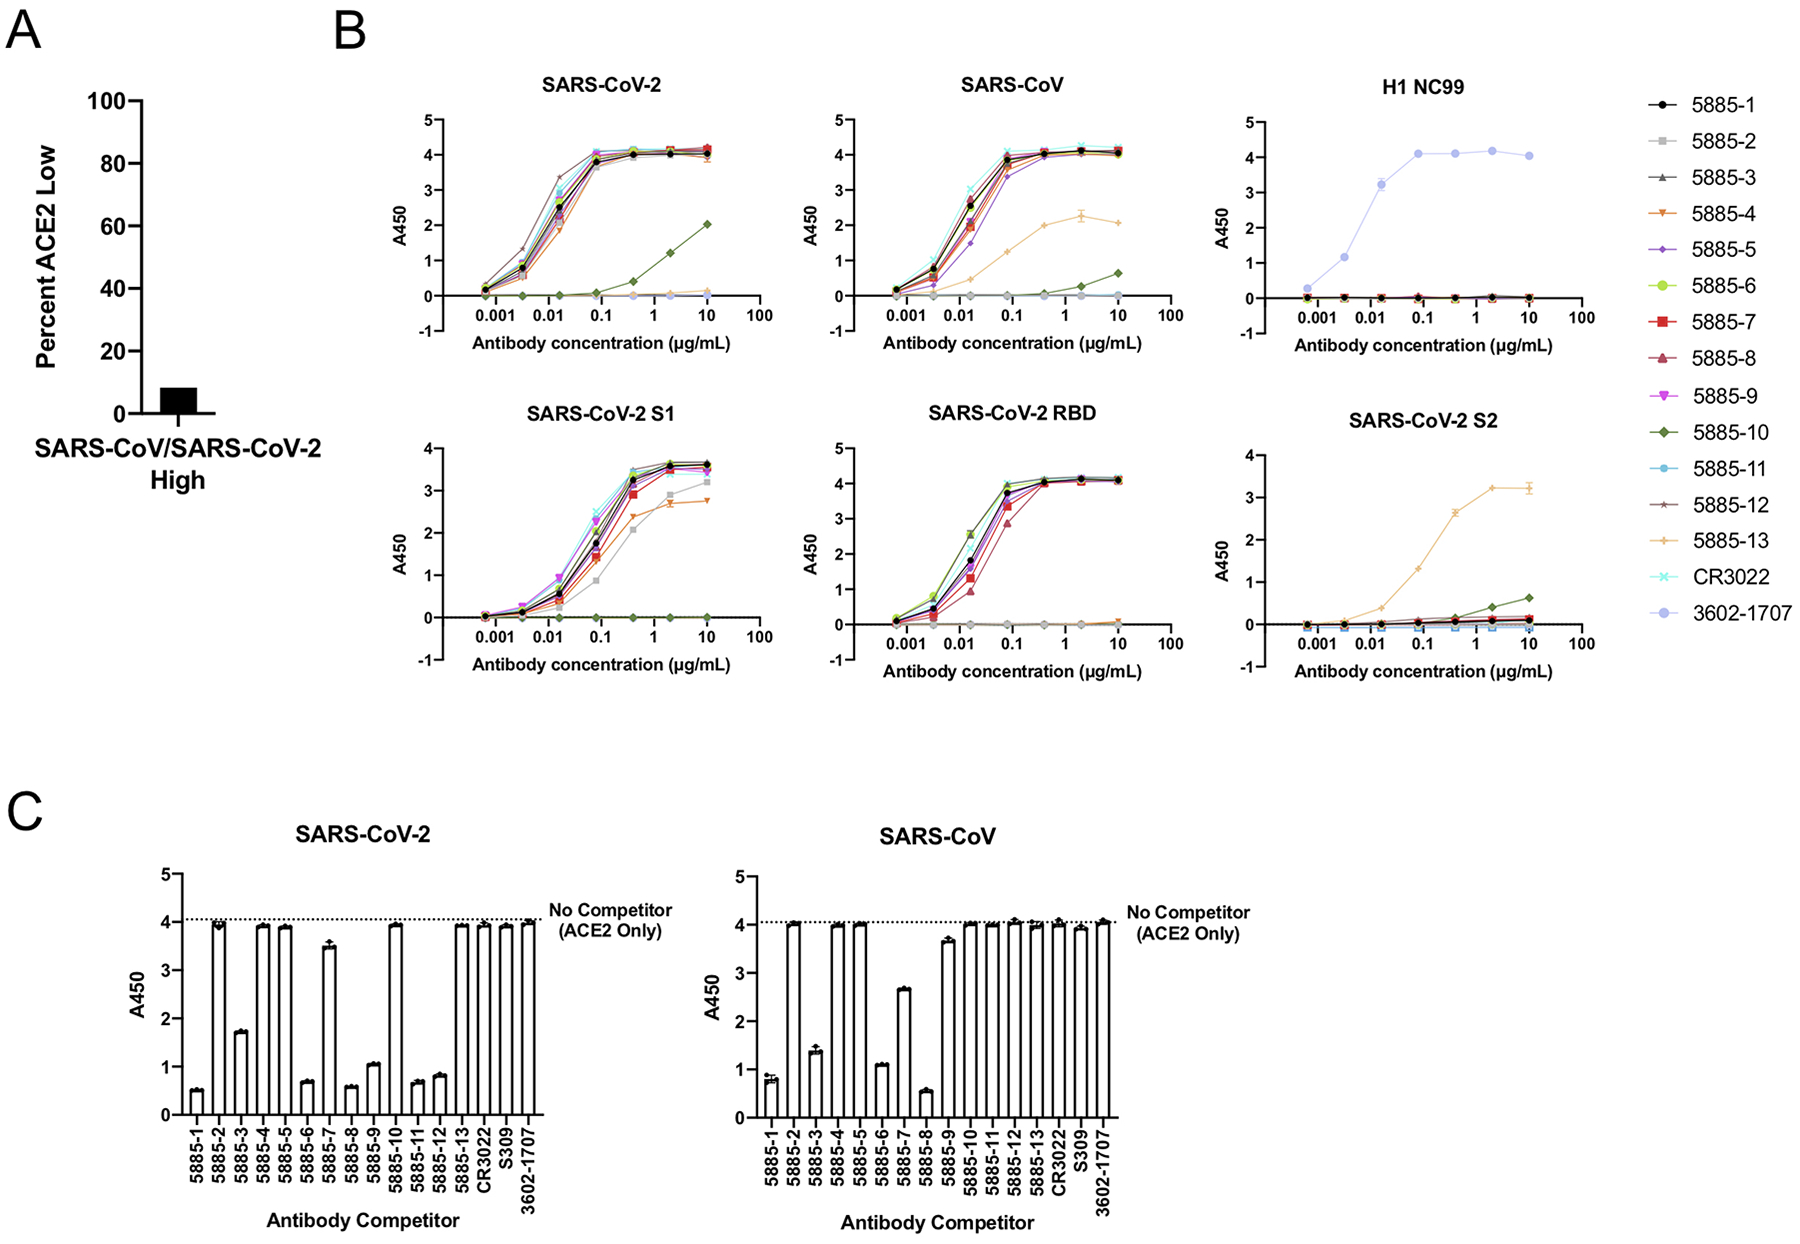
A. For the IgGs that showed high LIBRA-seq scores (>1) for both SARS-CoV-2 and SARS-CoV, the percent of cells with low ACE2 scores (<−1) is shown. B. ELISA binding of antibodies to SARS-CoV-2 spike, SARS-CoV spike, influenza hemagglutinin H1 NC99, SARS-CoV-2 S1, SARS-CoV-2 RBD, and SARS-CoV-2 S2. Data are represented as mean ± SEM of technical duplicates and represent one of at least two independent experiments (n=2). C. ACE2 blocking ELISA. ACE2 binding without competitor is shown as a dotted line. ELISAs were performed at one antibody concentration, and data are represented as mean ± SEM of technical triplicates and represent one of at least two independent experiments (n=2).