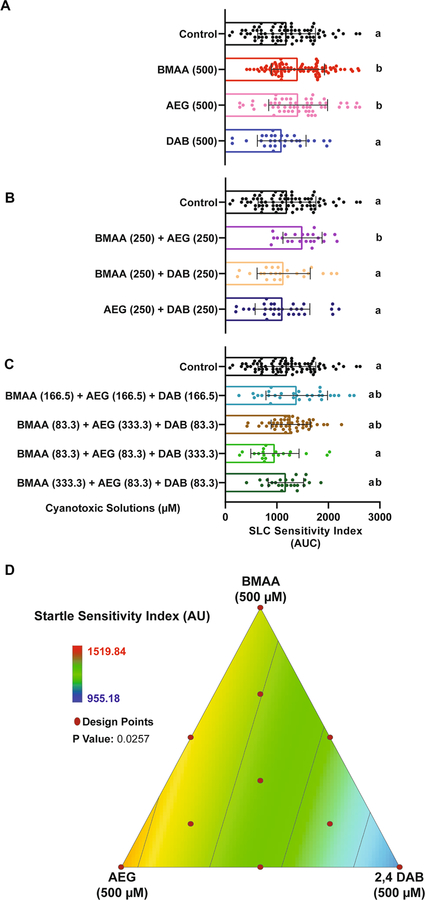
Fig. 4.
BMAA and AEG augment the short-latency c startle (SLC) response. A–C Bar graphs display the distribution of the short-latency C-bend (SLC) sensitivity indices for each tested larva after exposure to individual cyanotoxins, binary mixtures, and three-component mixtures, respectively. SLC sensitivity index is determined for each fish by calculating the area under the curve of SLC frequency vs. stimulus intensity (n = 108 siblings; mean ± SEM). Levels not connected by the same letter are significantly different (Tukey–Kramer HSD, Alpha 0.05). D 2D contour plot for the SLC sensitivity at different points in the design space, including each individual cyanotoxin (BMAA, AEG, and 2,4-DAB) and their seven different mixture ratios (Linear regression model, P = 0.0257)

