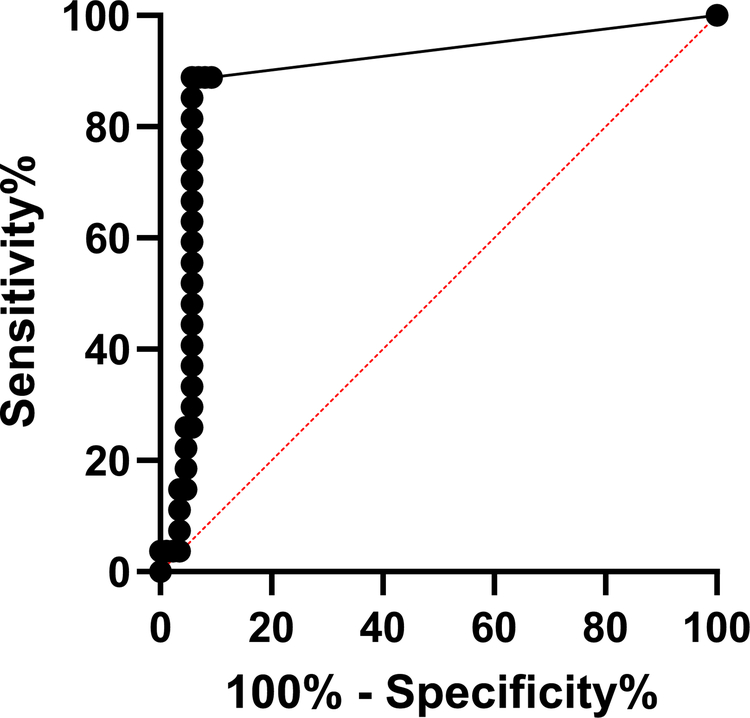
Figure 2. Receiver operating curve (ROC) of mSEPT9 comparison between EOCRC cases and healthy controls.
The ROC was generated by comparing the mSEPT9 cycle threshold (Ct) values of EOCRC cases and all healthy controls. The AUC (0.89) was statistically significant (standard error=0.04, 95% CI=0.81–0.97, p<0.001).

