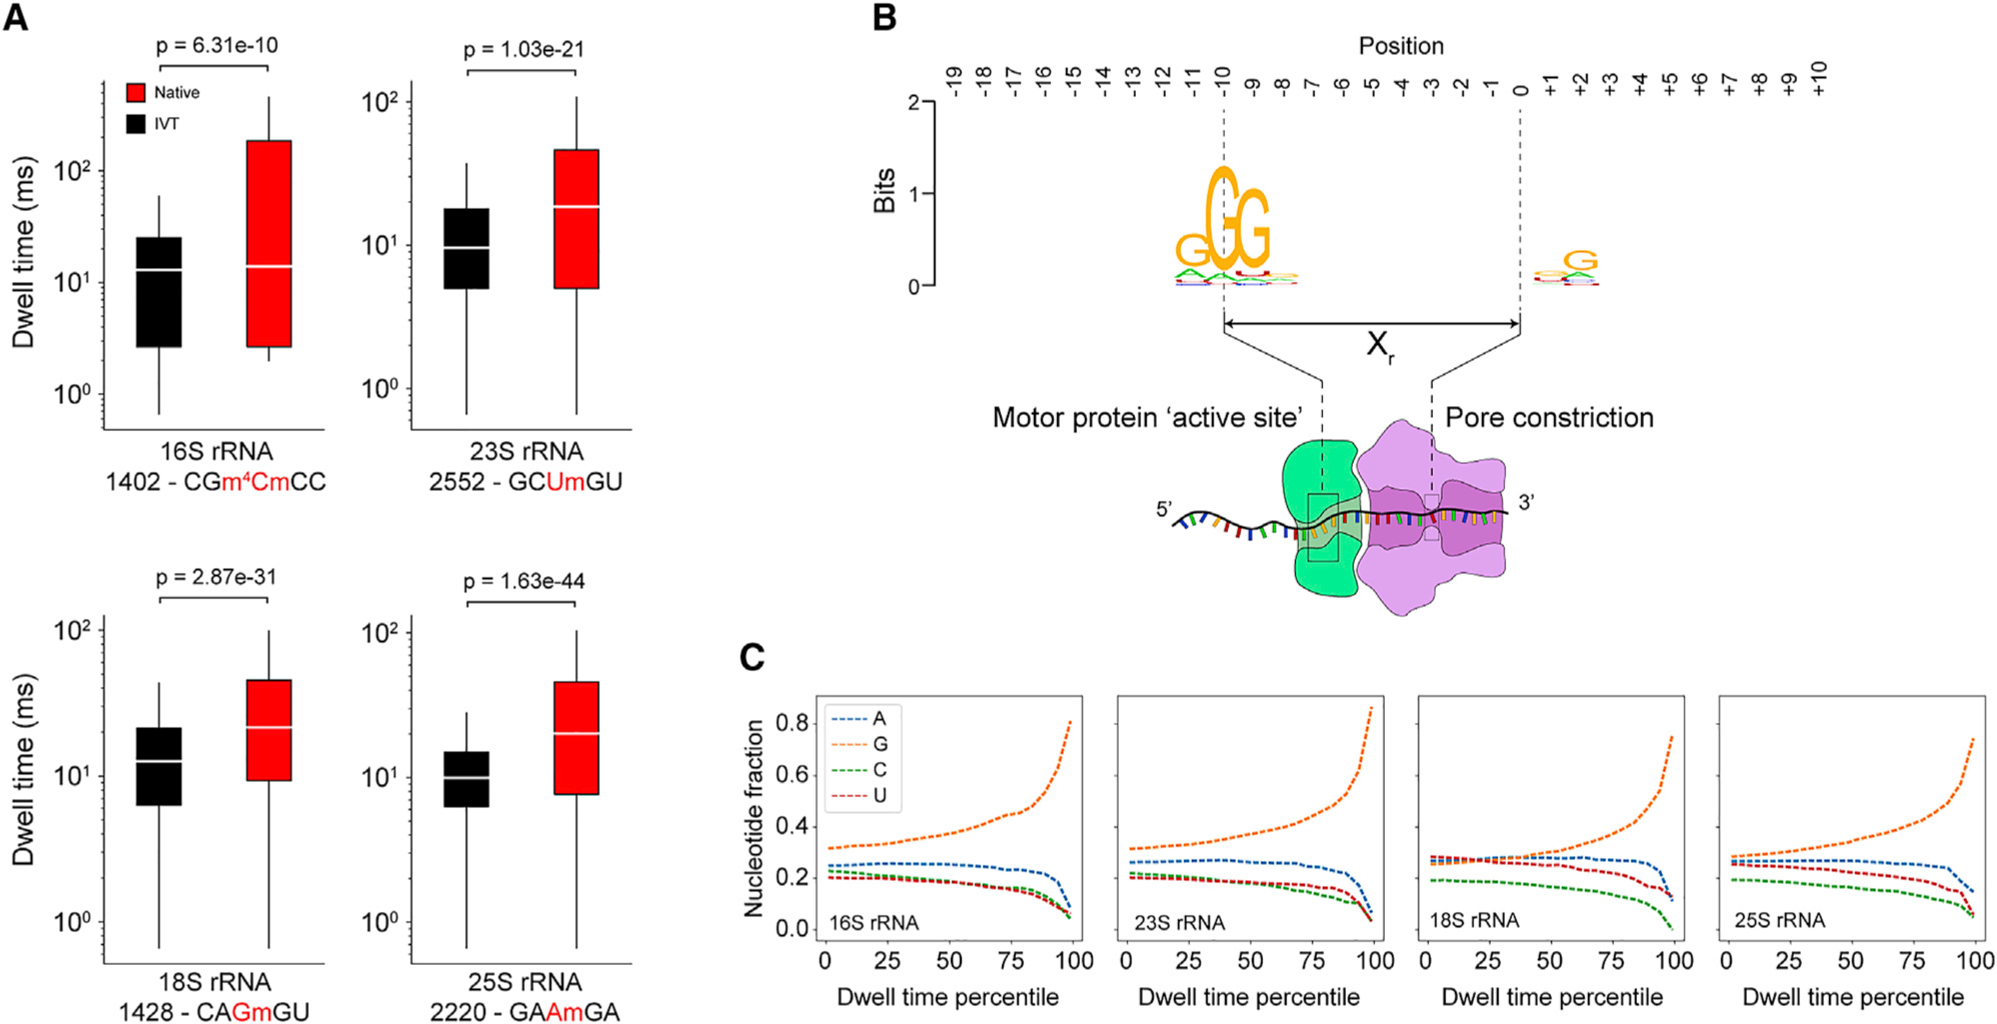
Figure 2. Dependence of dwell time on modifications and sequence.

(A) Dwell time comparison of native (red) and IVT (black) samples (Mann-Whitney U test, n = 1,000 reads) at selected Nm modification sites in 16S and 23S from E. coli and 18S and 25S from S. cerevisiae. Each box spans the interquartile range, the horizontal line within each box defines the median, and the whiskers extend out to the minimum and maximum values. The kmer is indicated below the x axis along with the position of the modification (red). Dwell times are from +Xr from the centered modification site kmer.
(B) Sequence motif from the top 1% of dwell times (IVT samples only, 16S, 23S, 18S, and 25S) spanning a 30-nt window encompassing the entire biomolecular sequencing complex.
(C) Nucleotide representation (fraction) within the trimer (positions −9, −10, and −11) from IVT samples as a function of dwell time percentile. The highest dwell time percentiles are enriched for guanosine within the trimer.
