
Figure 3. Acetylimidazole generates small adducts detectable by SHAPE-MaP.
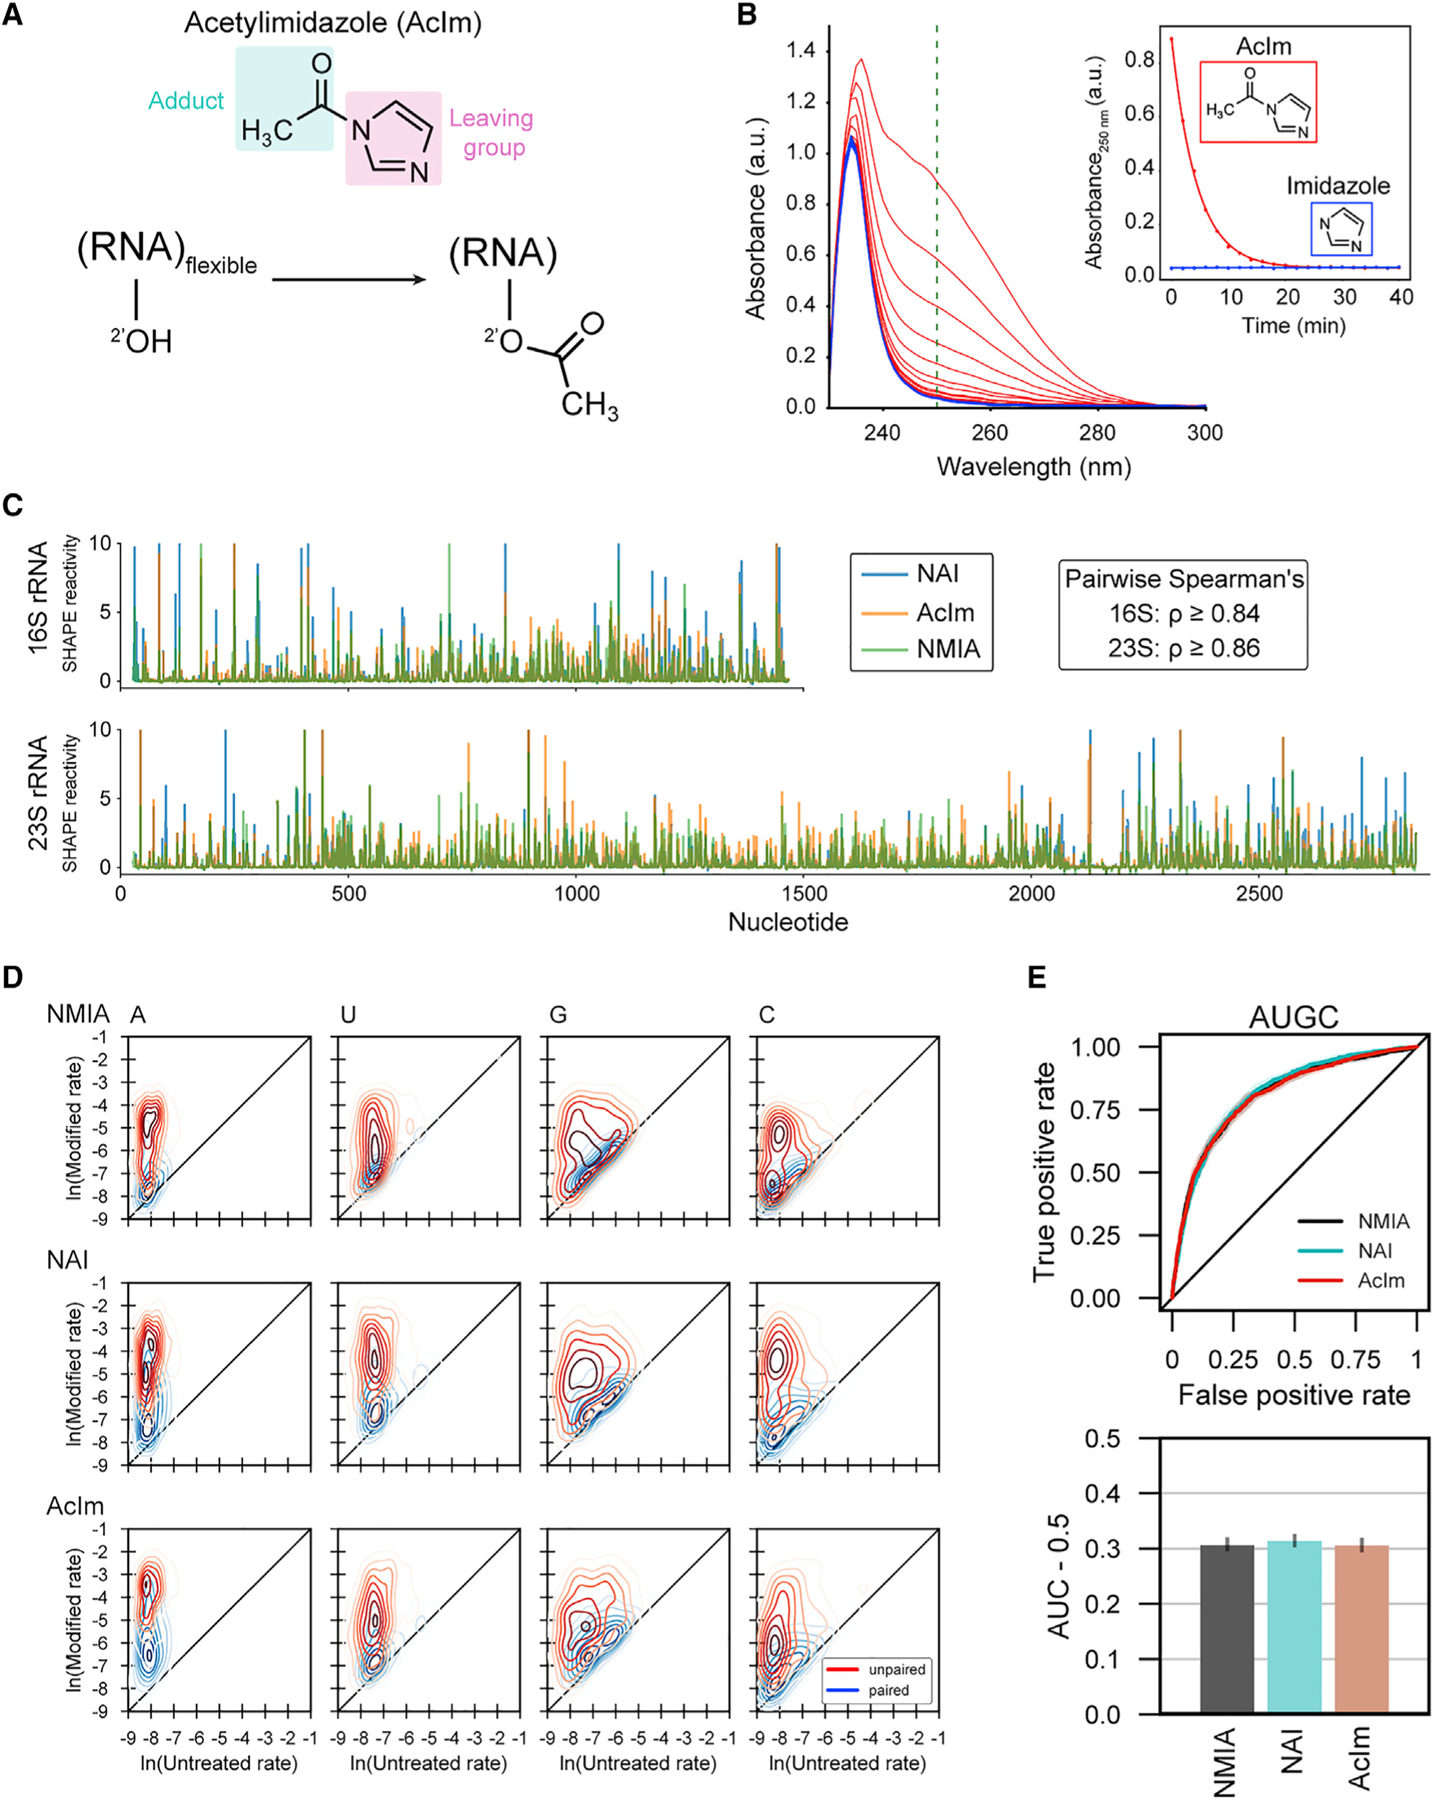
(A) Schematic of acylation of RNA with acetylimidazole (AcIm).
(B) Time dependence of hydrolysis for AcIm analyzed by changes in UV absorbance. Experiment performed at 37°C.
(C) SHAPE-MaP reactivity profiles using NMIA, NAI, and AcIm for E. coli 16S and 23S rRNAs.
(D) Two-dimensional kernel density estimates for NMIA, NAI, and AcIm adduct-induced mutation rates for E. coli 16S and 23S rRNAs with unmodified control and SHAPE-modified rates on the x and y axes, respectively. Separation between peak density distributions for paired (blue) versus unpaired (red) positions indicates reaction selectivity with respect to degree of nucleotide flexibility.
(E) Receiver operator characteristic curve and associated area under the curve (AUC) for MaP reactivities as a function of pooled nucleotide base-pairing status for SHAPE reagents. True positive rate: unpaired nucleotides with reactivity above a given threshold/total unpaired nucleotides. False positive rate: base-paired nucleotides with reactivity above a given threshold/total base-paired nucleotides.