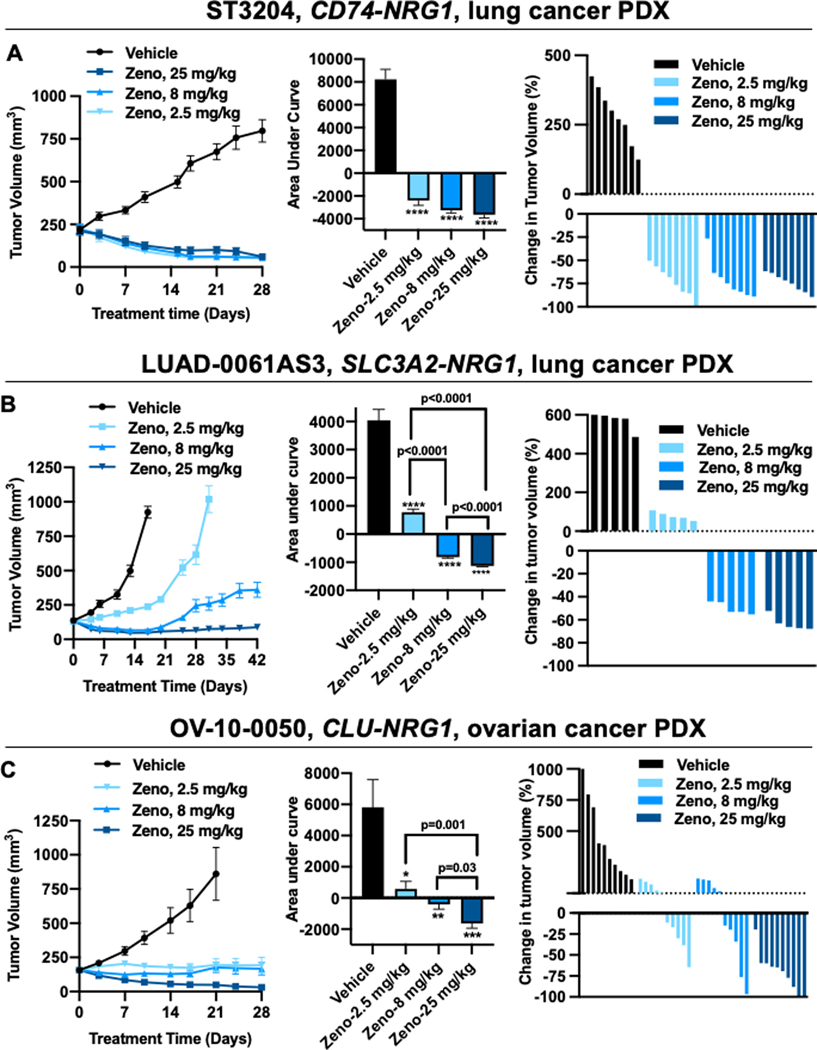
Figure 3. Zeno induces tumor regression in PDX models of NRG1-rearranged cancers.
Mice bearing PDX tumors were treated with the indicated doses of Zeno once weekly. For each model, the figure shows the tumor volume (left panel), area under the curve analysis (AUC, middle panel), and the change in volume of individual tumors at the time representative of the AUC analysis (right panel). A. ST3204 PDX model (lung cancer; eight mice per group). AUC analysis was performed for the time period ending on day 28. Tumor growth in Zeno-treated animals was significantly lower than that in vehicle-treated animals as measured by AUC (****P<0.0001), with no significant difference between the AUC values of the Zeno-treated groups (P>0.05). B. LUAD-0061AS3 PDX model (lung cancer; five mice per group). AUC analysis was performed for the time period ending on day 17. ****P<0.0001 compared with the vehicle-treated group. C. OV-10–0050 PDX model (high-grade serous ovarian cancer; 10 mice per group). AUC analysis was performed for the time period ending on day 21. *P=0.03, **P=0.006, ***P=0006 compared with the vehicle-treated group. Results in all left and middle panels represent mean ± SEM. Administration of Zeno had no adverse effect on animal weight during the course of treatment (Supplementary Figure S4).

