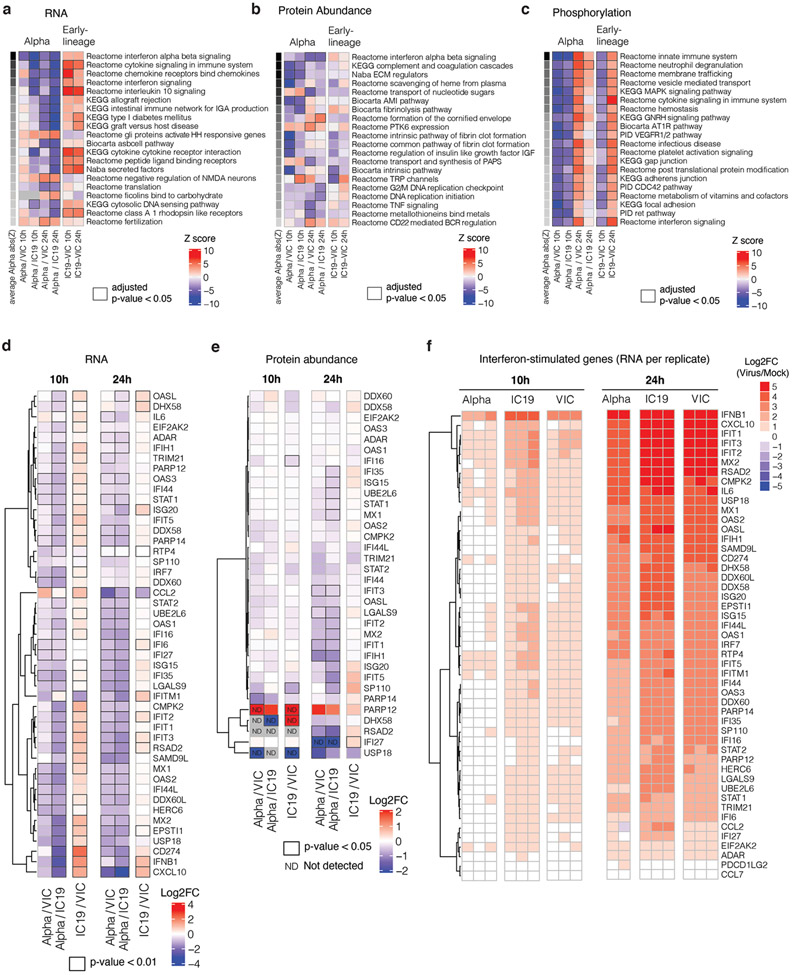
Extended Data Fig. 4. Omics data highlights recruitment of innate immune signaling.
a. Gene set enrichment analysis based on log2FC method using RNA dataset (as in Fig. 2b). Ranking is based on the average of the absolute value z-scores across the indicated contrasts involving Alpha (per row). Black borders indicate an adjusted p-value<0.05. b. Same as in a, but for abundance proteomics dataset. c. Same as in a, but for phosphoproteomics dataset. If a protein possessed multiple phosphorylation sites, the maximum absolute value log2FC was used as the representative value for the protein. Finite values (non-infinite) were prioritised over quantitative values. d. Expression of interferon-stimulated genes from Lui et al (2018)27 (see Methods) using the RNAseq dataset. Significant fold changes with an adjusted p-value<0.05 are indicated with black borders. e. Same as in (a) using the abundance proteomics dataset. N.D. indicates proteins either not detected in one condition (thus, Inf or -Inf) or not detected in both conditions. f. RNA expression per biological replicate of interferon-stimulated genes (ISGs) for each virus versus mock.

