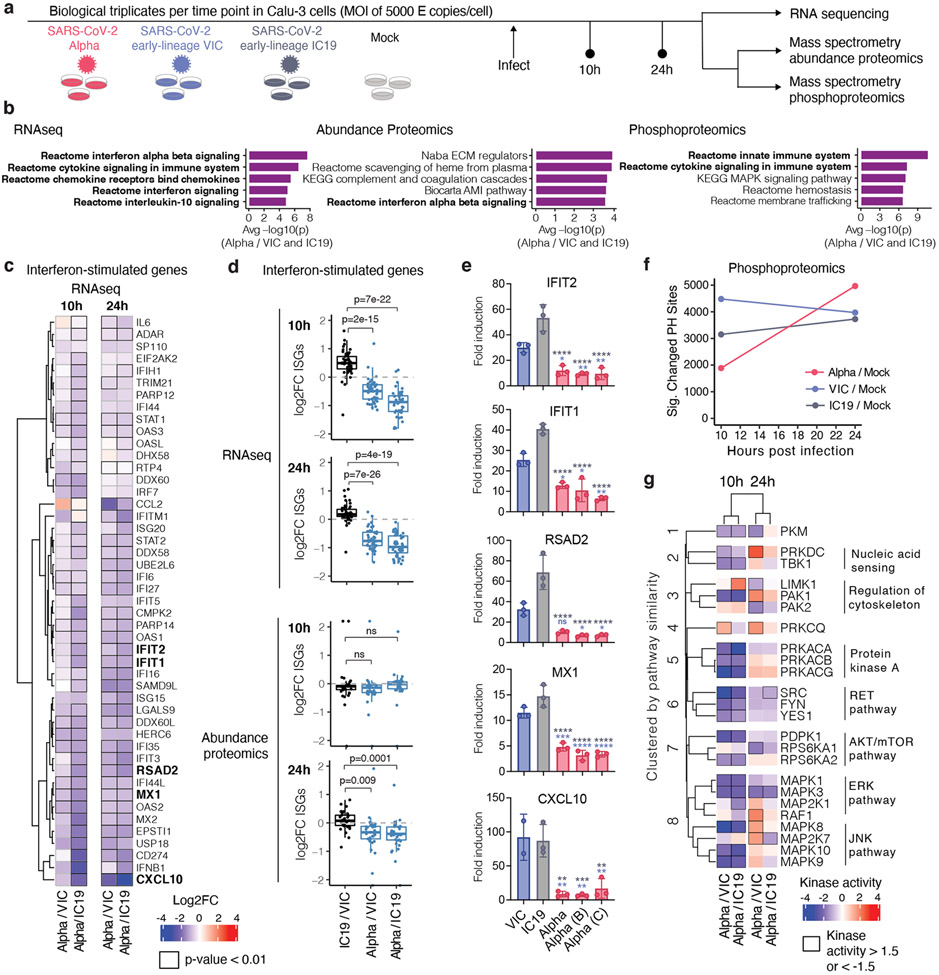
Figure 2. Global RNAseq and proteomics reveal innate immune suppression by Alpha.
a. Schematic of the experimental workflow. Calu-3 cells were infected with SARS-CoV-2 Alpha (red), VIC (blue) or IC19 (grey) or mock-infected. Phosphoproteomics and abundance proteomics analysis using a data-independent acquisition (DIA) and total RNA-sequencing was performed at 10 and 24h. b. Unbiased pathway enrichment analysis. The -log10(p-values) were averaged for enrichments using Alpha/VIC and Alpha/IC19 at 10 and 24 hpi to rank terms. The top 5 terms are shown. Innate immune system terms are bolded. c. Heatmap depicting log2 FC (color) of ISGs32 comparing Alpha to VIC or IC19. Black outlines indicate p<0.01. d. Box plots show log2 FC of ISG between Alpha/VIC, Alpha/IC19 or IC19/VIC. Dots indicate different ISGs. e. RT-qPCR analysis of bolded ISGs from (a) in cells infected with 2000 E copies/cell. f. Number of phosphorylation sites significantly dysregulated for Alpha, VIC, or IC19 versus mock at an absolute log2 FC > 1 and adjusted p-value < 0.05. g. Kinase activities for the top enriched terms for the phosphoproteomics dataset “Reactome innate immune system” (b, right). Mean +/− SEM (e). Two-tailed student’s t-tests (d) or Two Way ANOVA with Tukey’s multiple comparisons post-test (e) were used. Blue stars: Alpha vs VIC (blue bars), grey stars: Alpha vs IC19 (grey bars). * (p<0.05), ** (p<0.01), *** (p<0.001), **** (p<0.0001), or exact p-value (d). ns: non-significant. FC, fold change.

