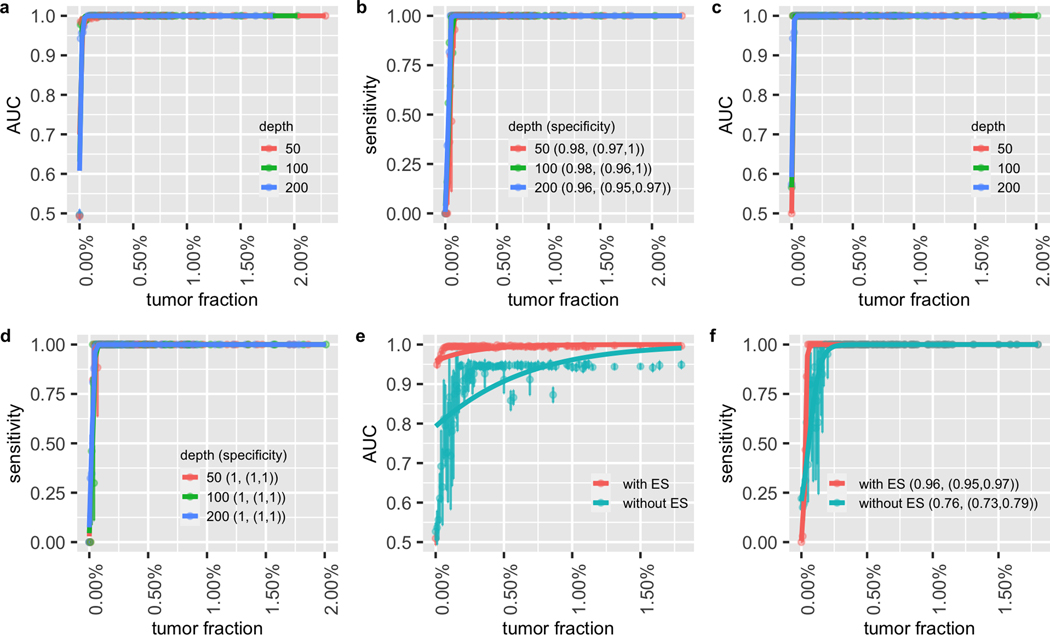
Figure 3. Performance of cancer recurrence and MRD detection using the simulation data.
The area under the ROC curve (AUC) of the MRD/recurrence detection on (a) the validation dataset and (c) the independent dataset with different tumor fractions and sequencing depths. The sensitivity and specificity with different tumor fractions and sequencing depth on (b) the validation dataset and (d) the independent dataset. Figure S6 (a–d) is the zoom-in of (a-d) at low tumor fraction ranging from 0% to 0.2%. (e) AUCs of MRD/recurrence detection with and without error suppression (ES) on the validation dataset at 200x depth with different tumor fractions. (f) The sensitivity and specificity of MRD/recurrence detection with and without error suppression on the validation dataset at 200x depth with different tumor fractions. In (a), (c) and (e), the dots indicate the average AUC, and the vertical bars indicate average ± SD of the AUC (see Material and Methods). In (b), (d) and (f), the dots show the average sensitivity using a cutoff p-value = 0.05 for the background noise distribution; the vertical bars indicate average ± SD of the sensitivity; the specificity is shown in the legend in the format of (average specificity, (average - SD, average - SD)). The solid lines show the smoothed performance fitted with logit functions.

