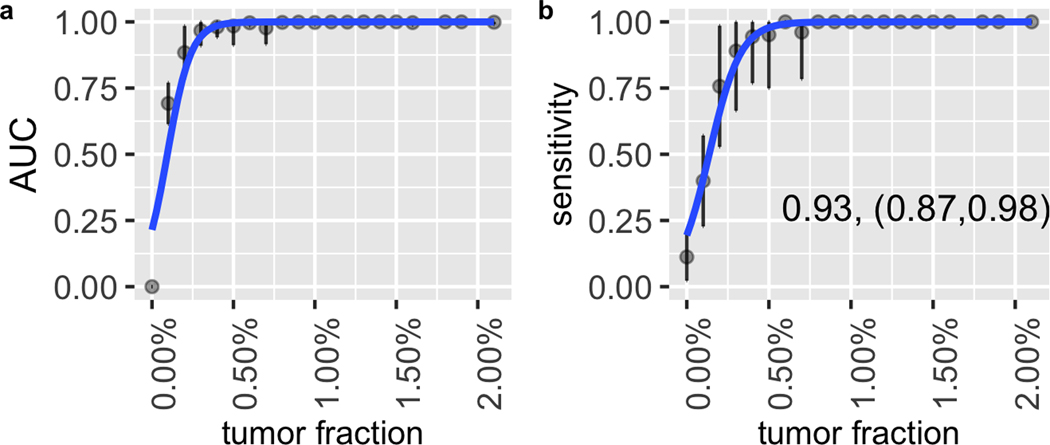
Figure 4. Performance of second primary cancer detection with the simulation data.
(a) AUC of the in silico spike-in samples with different tumor fractions at 200x sequencing depth. The dots indicate the average AUC, and the vertical bars indicate average ± SD of the AUC (see Material and Methods). (b) The sensitivity and specificity in the in silico spike-in samples with different tumor fractions at 200x sequencing depth. The dots show the average sensitivity using a cutoff of the 95th percentile of prediction scores from the remission samples in the training data; the vertical bars indicate average ± SD of the sensitivity; the specificity is shown in the text in the format of (average specificity, (average - SD, average + SD)). The solid lines show the smoothed performance fitted with a logit function.

