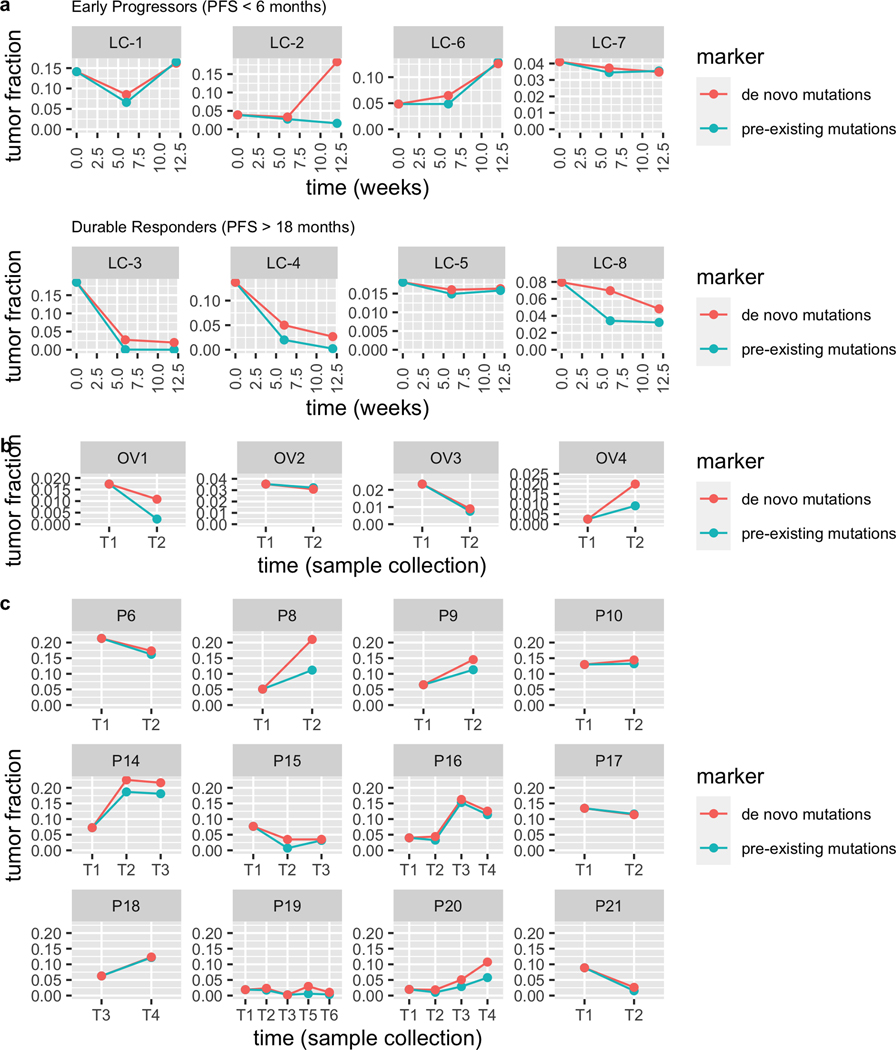
Figure 5. Longitudinal cfDNA monitoring in cancer patients who received treatments.
The lines show the tumor fraction in cfDNA during treatment. (a) Tumor fraction in plasma samples of 8 NSCLC patients who received anti-PD-1 immunotherapy. (b) Tumor fraction in serum samples of 4 ovarian cancer patients. (c) Tumor fraction in plasma samples of 12 prostate cancer patients.

