
Figure 1:
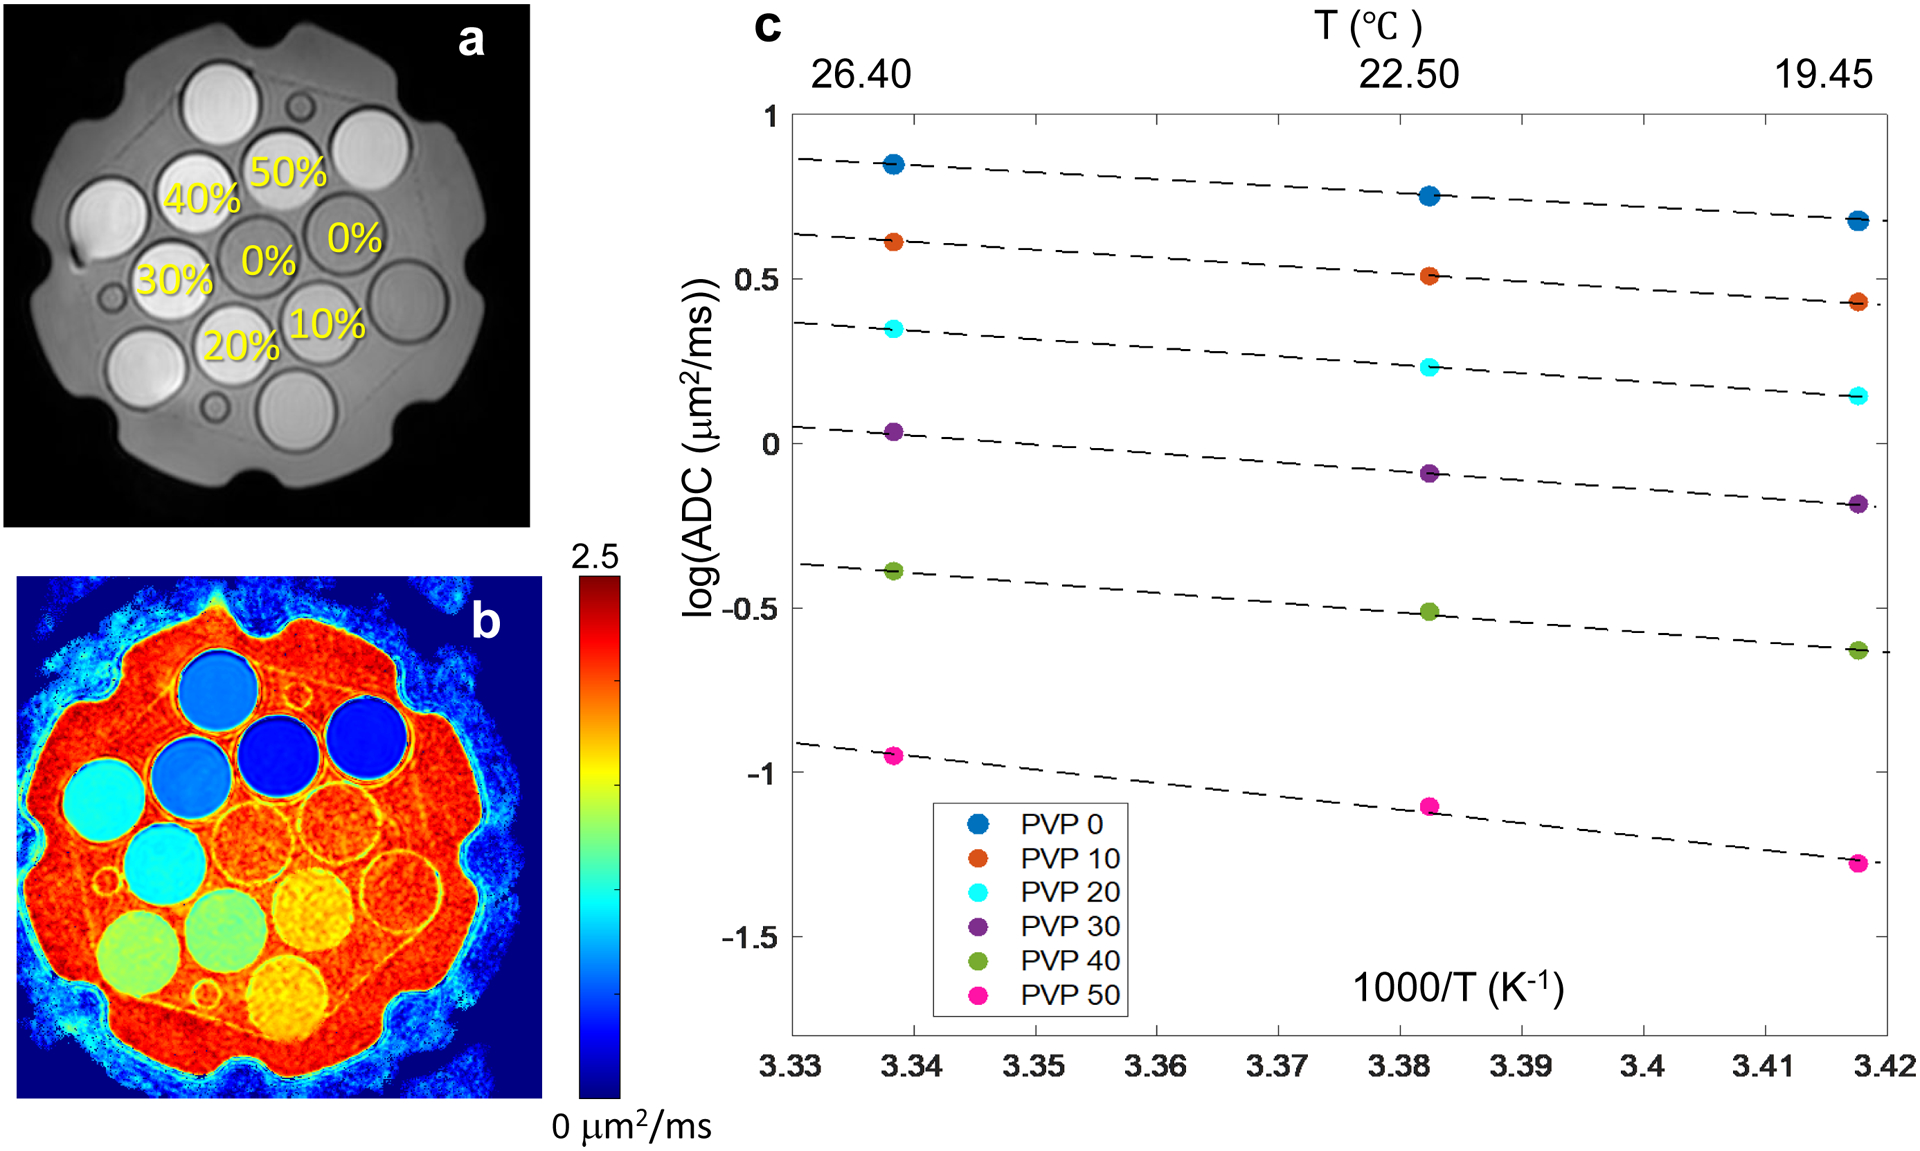
QIBA/NIST PVP diffusion phantom (a) MR image illustrating vials’ position and PVP %weight/weight concentration. (b) shows corresponding ADC map at 26.4° C, and (c) shows log of ADC values for each PVP concentration (data symbols color-coded in the legend) at three measured temperatures (top axis). Dashed lines display the linear fits to the log(ADC) data as a function of inverse temperature (bottom axis) with the corresponding measured ADC values and fit coefficients summarized in Tables 1 and 2, respectively.