
Figure 3:
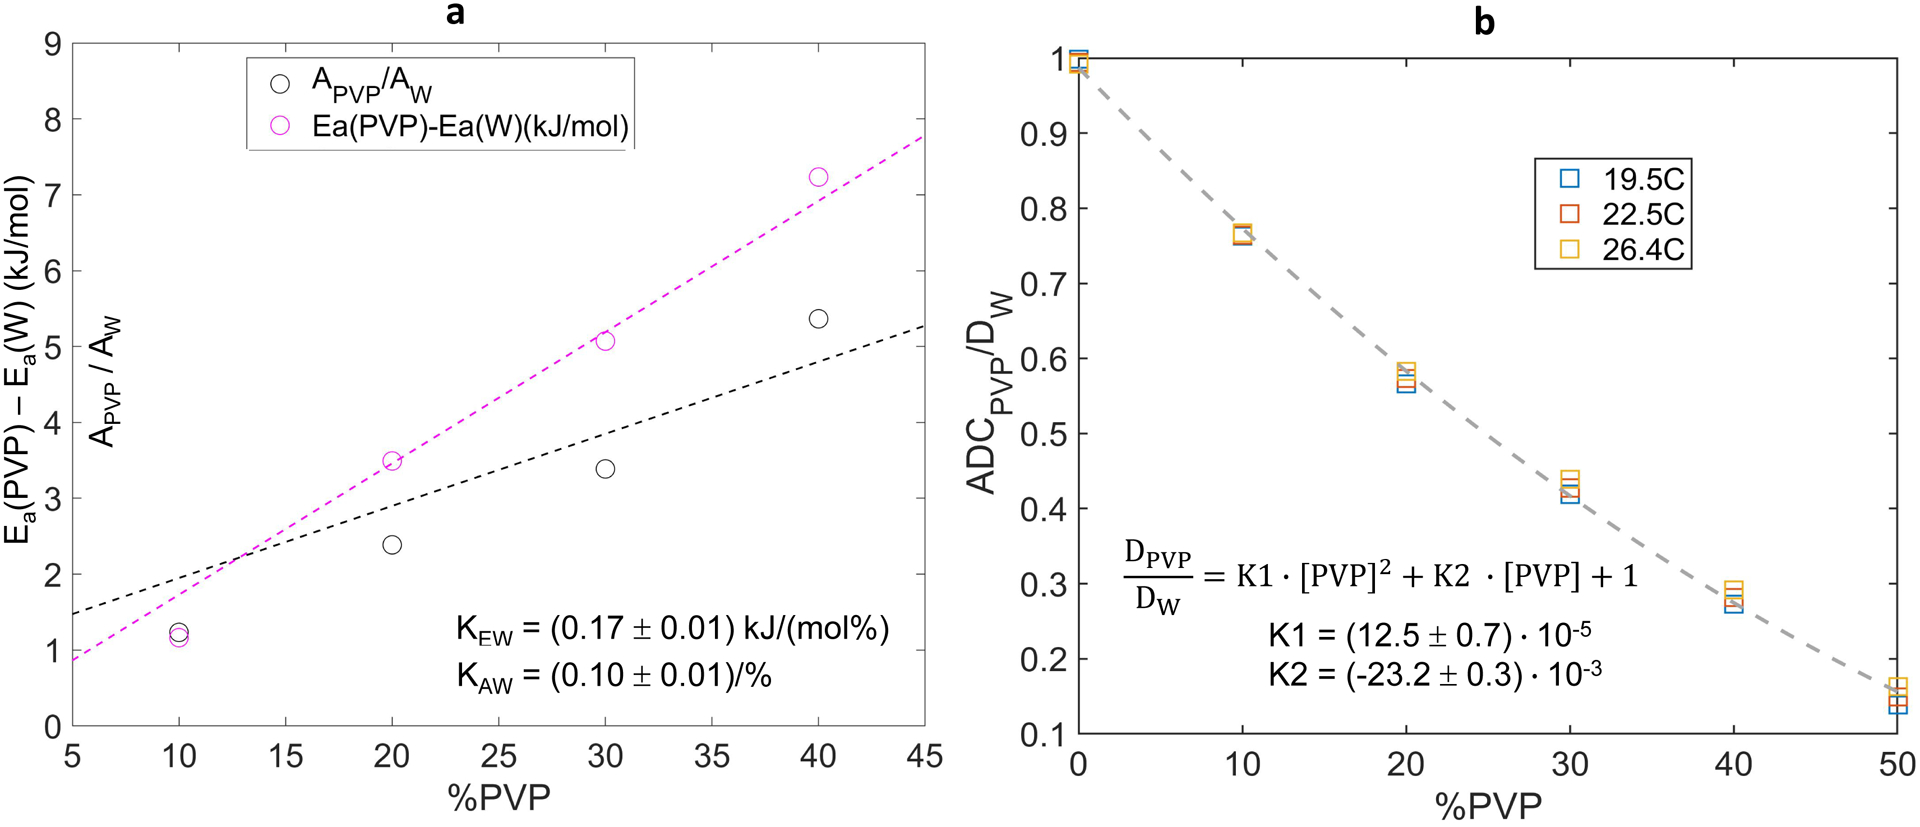
Concentration dependence of deviation from pure water (W) values of Arrhenius model fit diffusion parameters (collision frequency, A, and activation energy, Ea) is shown in (a) for 0% to 40% PVP. The vertical axis in (a) is common for difference in activation energies and ratio of collision frequencies relative to pure water. Measured ADCPVP normalized to the theoretical diffusion value of pure water, DW (calculated from Speedy-Angell relation) is shown in (b) for 0% to 50% PVP and three temperatures color-coded in the legend. Dashed curves show the linear (in a) and quadratic (in b) least squares fit for %PVP dependence over plotted ranges. The fit intercepts were constrained to 1 (for normalized A and ADC) and 0 (for Ea difference), and the fit slopes are listed on the figures.