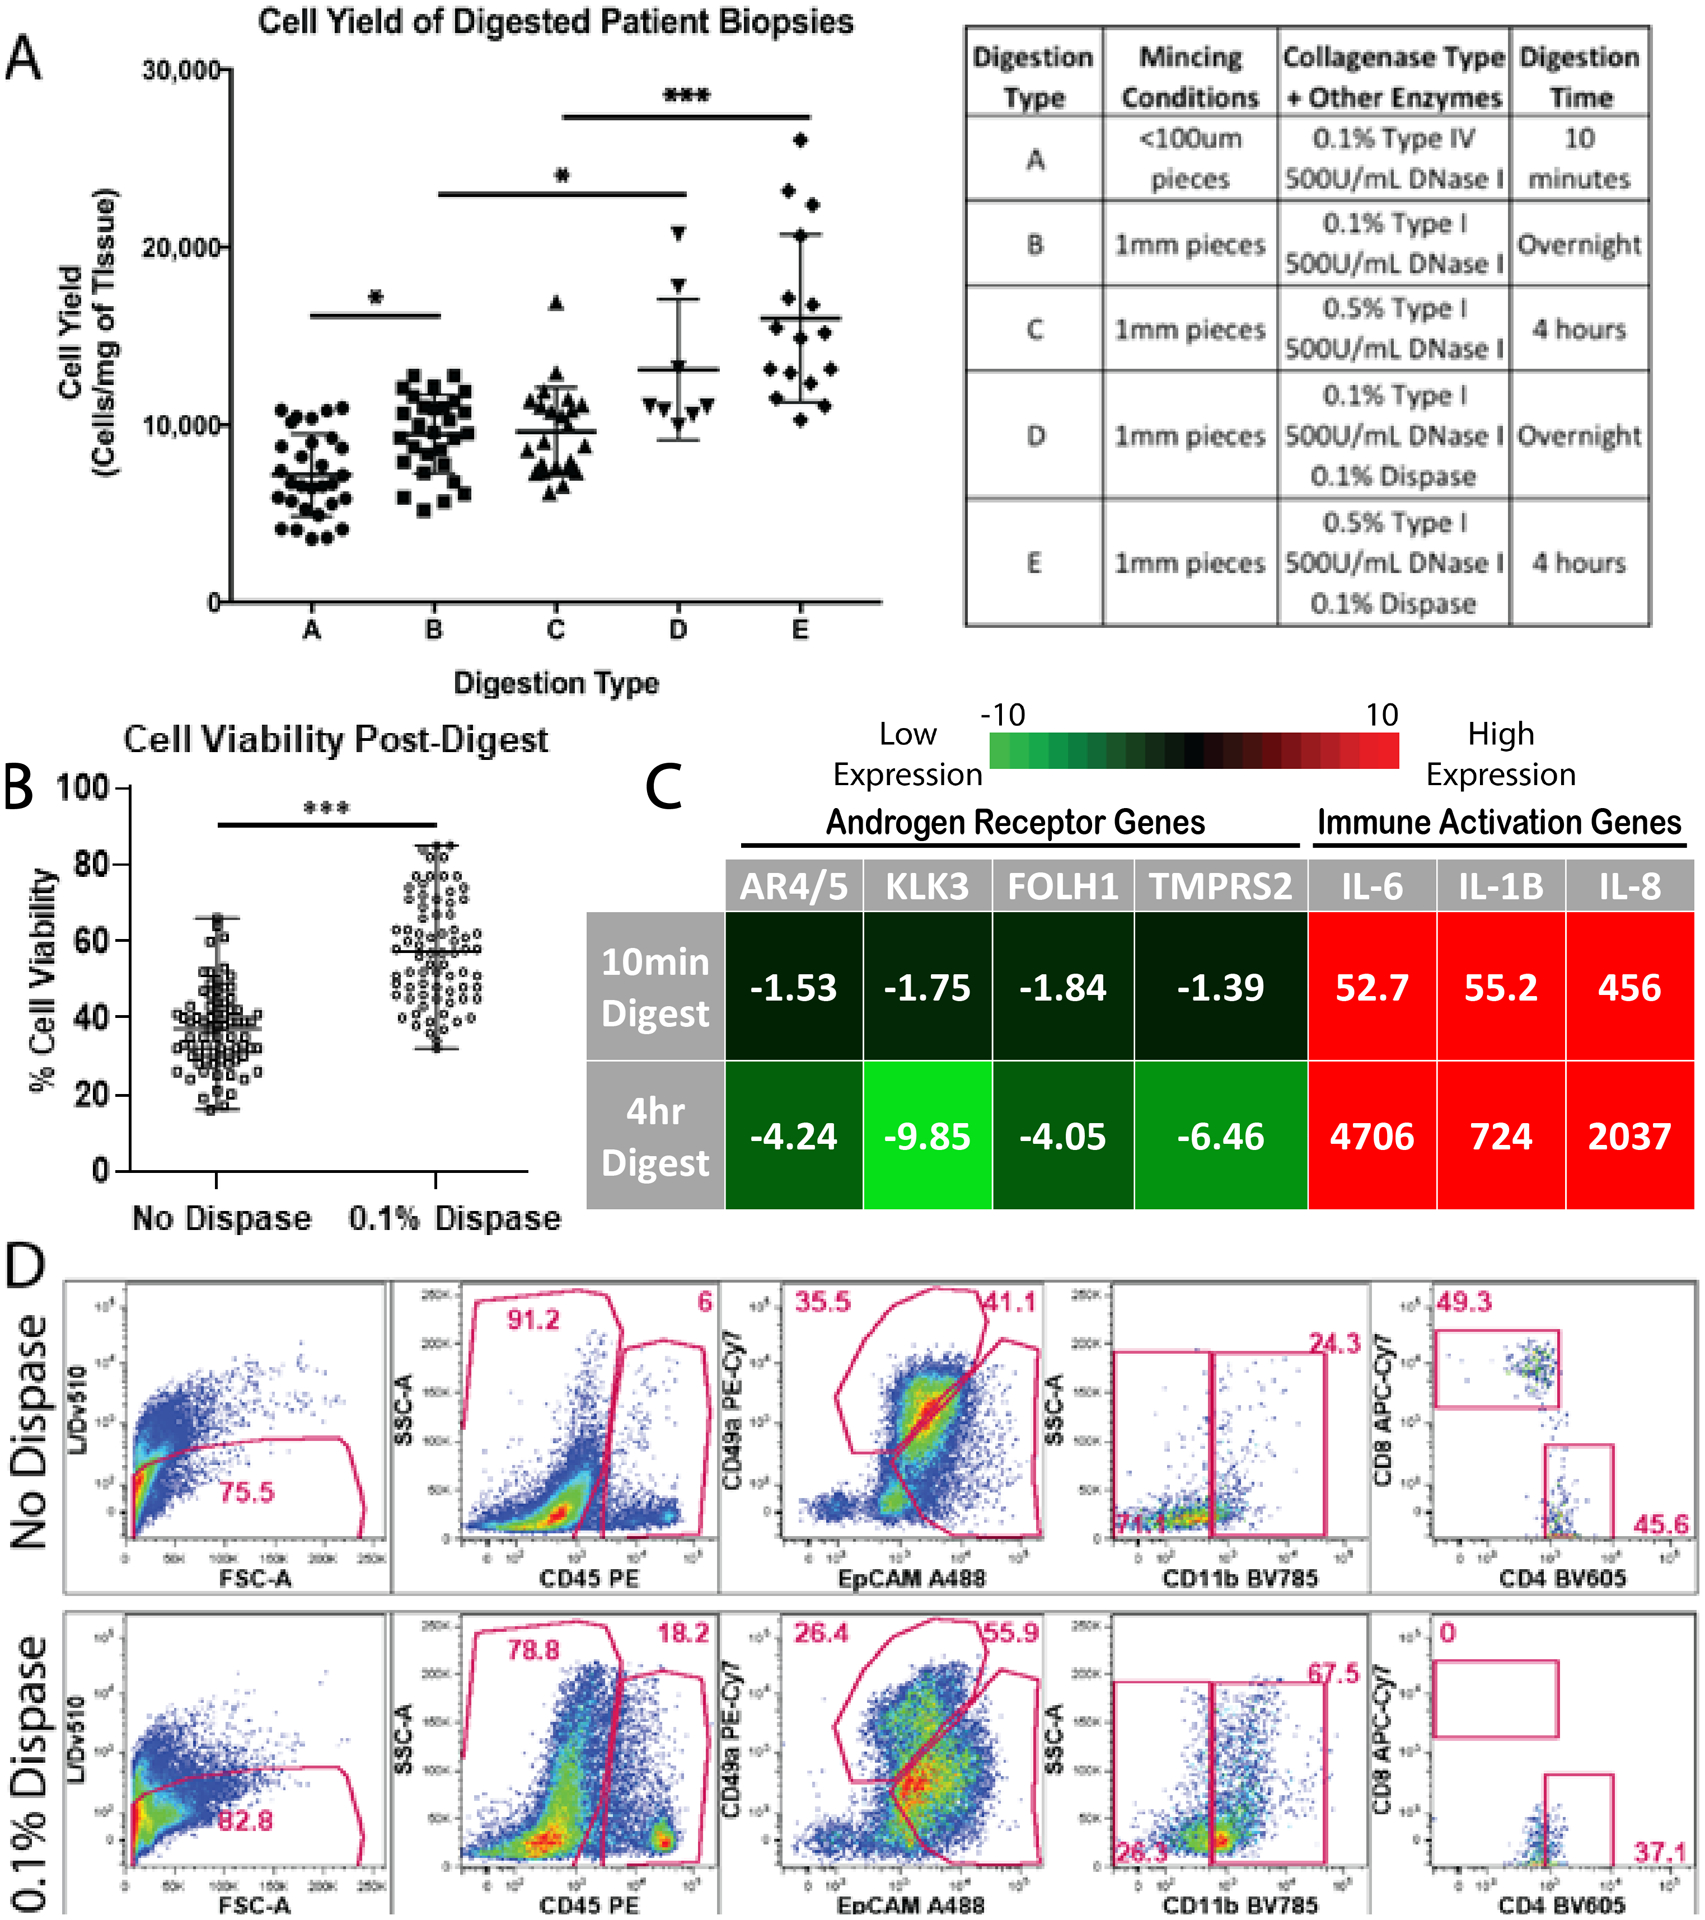
Figure 4: Varying tissue digestion enzymes impacts cell yield, viability, and cellular populations.

(A) Scatter plot displays mean cellular yields, with standard deviation, from individual prostate biopsies digested using numerous tissue digestion conditions. Digestion conditions A, B, C, D, and E are listed in the corresponding table (* indicates p-value <0.05, *** indicates p-value <0.001). (B) Scatter plot displays mean cell viability, with standard deviation, from individual prostate biopsies with and without 0.1% dispase added to digestion buffers (*** indicates p-value <0.001). (C) q-PCR measures androgen receptor transcripts (AR4/5, KLK3, FOLH1, TMPRSS2) and immune cell activation transcripts (IL-6, IL-1B, IL-8) from cells for both 10-minute digestion protocols and 4-hour digestion protocols. Fold change values are normalized to undigested tissue and averaged, n=3. (D) Gated flow cytometry dot plots display cell populations present in digested prostate samples from patient PB054 biopsies, with and without 0.1% dispase added (top row and bottom row respectively). The first column represents the live/single cell content of the isolates when is then projected to show CD45 expression in the second column. The third column represents EpCAM and CD49a expression within the CD45- fraction. The fourth and fifth columns show CD11b expression within the CD45+ subset and CD4/CD8 expression within the CD45+/CD11b- gate, respectively. Data shows frequency within the parent gates.
