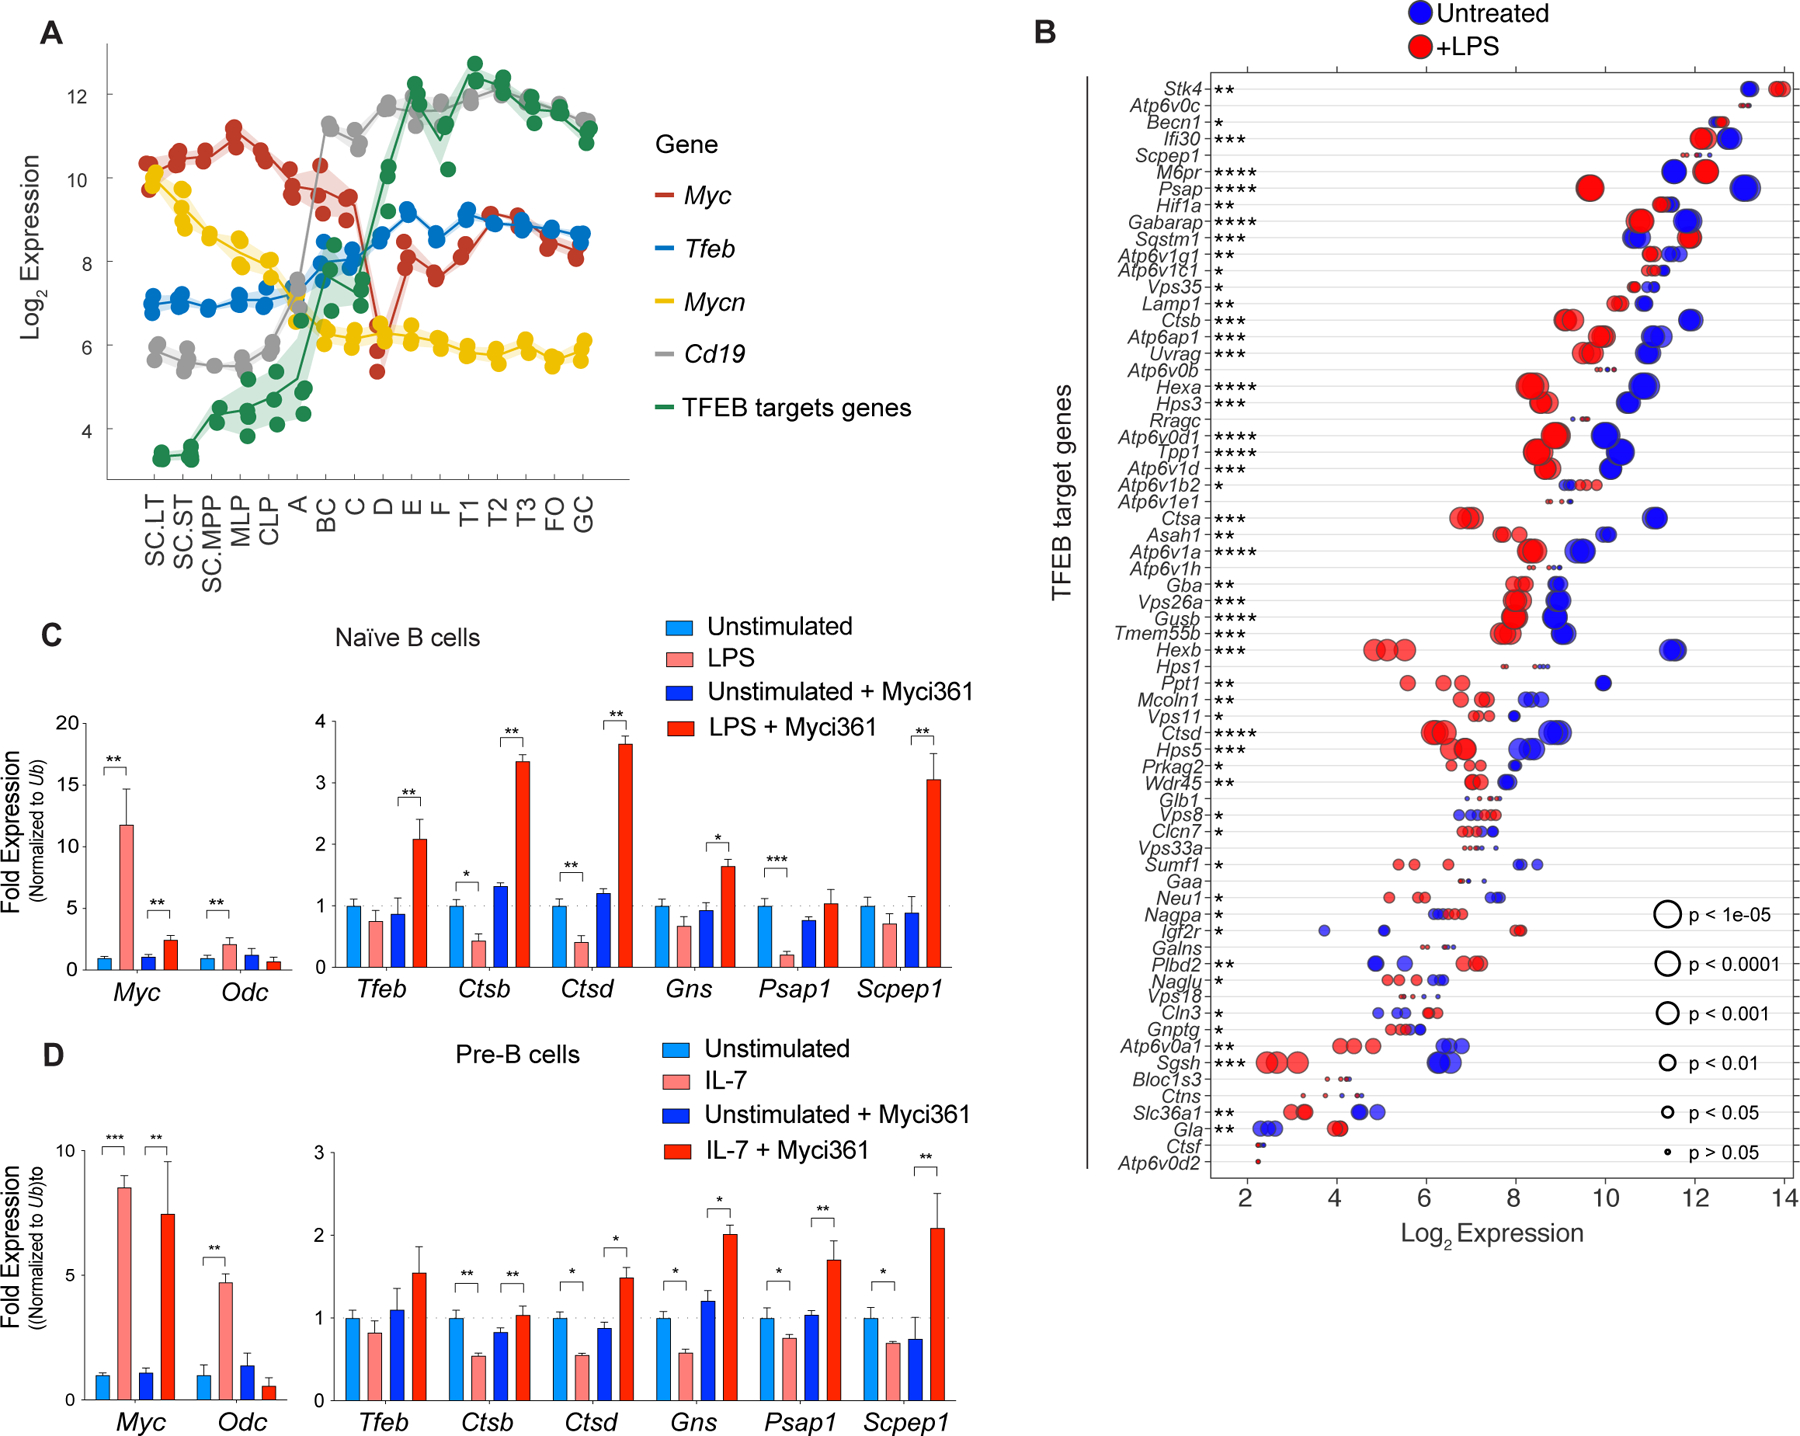
Figure 2.

A MYC-TFEB circuit is manifest during B cell development and mitogenic signaling. A, Log2 expression levels of Tfeb, Tfeb target genes, Myc, Mycn and CD19 transcripts at different stages of mouse B cell development (Immgen Dataset). B, Gene expression profile of LPS-stimulated naïve mouse splenic B cells (GSE37222). Log2 gene expression of Tfeb target genes was plotted in a dot plot ordered based on expression. Each dot represents one sample, and dot size corresponds to its statistical significance as shown. C, qRT-PCR analyses of expression of Myc, Odc, Tfeb and the indicated TFEB target genes in naïve mouse splenic B220+ B cells (Unstimulated) or following stimulation of these cells with LPS for 4 hr (+ LPS), or naïve mouse splenic B220+ B cells pretreated with the Myc inhibitor Myci361 for 2 hr followed by stimulation of these cells with LPS for 4 hr (+ LPS) versus those not treated with LPS (Unstimulated). D, qRT-PCR analyses of Myc, Odc, Tfeb and TFEB target genes in pre-B cells that were deprived of IL-7 for 18 hr (Unstimulated) and then treated with IL-7 (+ IL7) for 6 hr in the absence or presence of the Myc inhibitor Myci361. Statistical analysis: C-D, Student’s t-tests were performed. Data are represented as mean ± SD (n = 3). *, p ≤ 0.05; **, p ≤ 0.01; ***, p ≤ 0.001; ****, p ≤ 0.0001.
