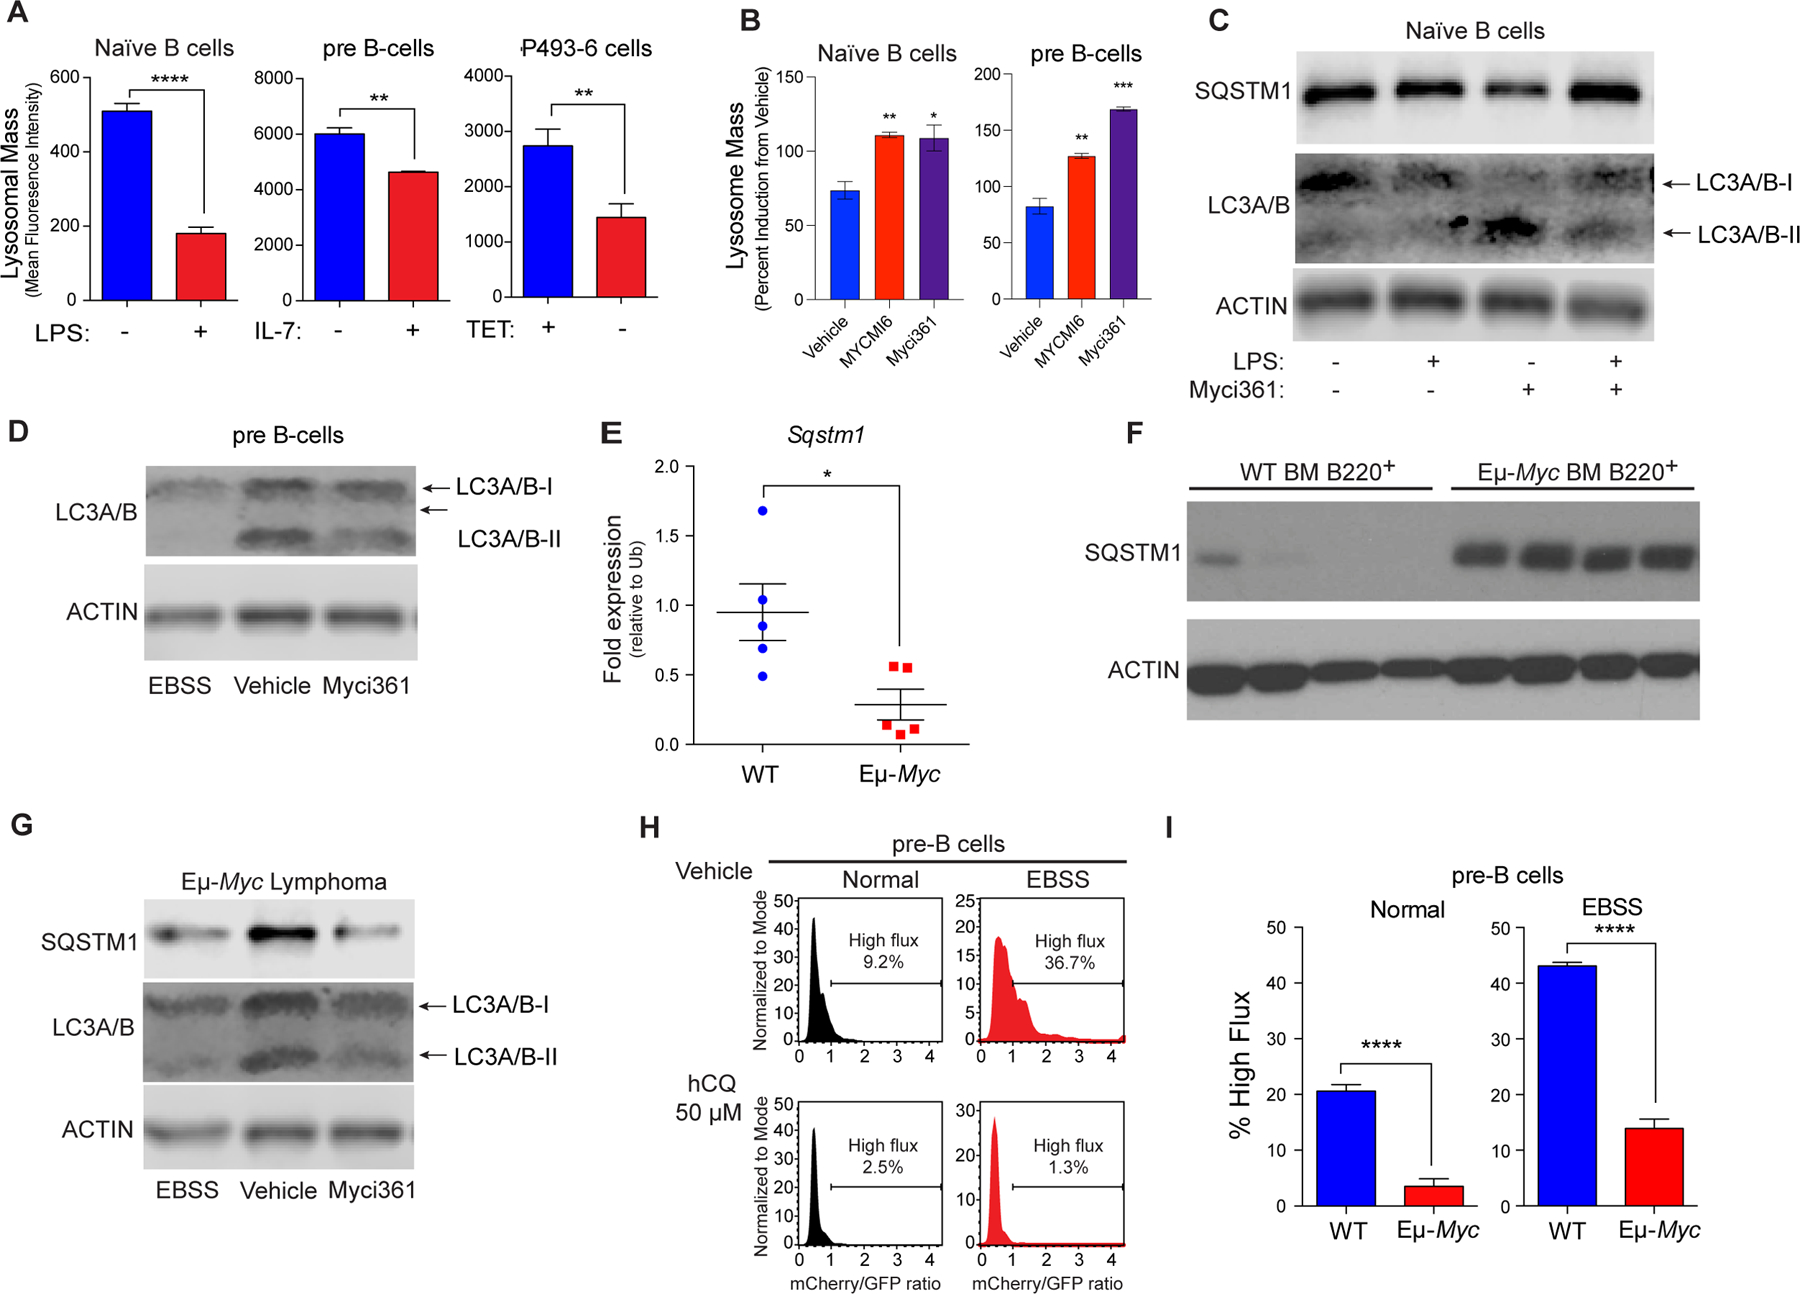
Figure 3.

MYC blocks autophagic flux. A, Mean fluorescent Intensity (MFI) of Lysotracker staining in (left to right): untreated vs. LPS-treated (6 hr) naïve splenic mouse B cells; IL-7 deprived (18 hr) pre-B cells that were then re-stimulated with IL-7 for 6 hr; and P493–6 B lymphoma cells treated with TET for 48 hr and released from TET for 4 hr (n = 3 for all). B, MFI of LysoTracker staining of naïve B or pre-B cells treated with vehicle or with the Myc inhibitors Myci361 or MYCMI6 for 2 hr prior to stimulation with either LPS or IL-7, respectively. C, Western blot analysis of SQSTM1, and LC3A/B isoforms in naïve splenic B220+ B cells that were left untreated or pretreated with Myci361 for 2hr followed by treatment with or without LPS for 4 hr. D, Western blot analysis of LC3A/B isoforms in pre-B cells (cultured in IL-7 medium) that were treated with vehicle or with Myci361 for 2 hr, or that were shifted to EBSS medium for 6 hr. E and F, qRT-PCR (E) and Western blot (F) analysis of SQSTM1 levels in WT versus premalignant Eμ-Myc BM B220+ cells (n = 5 for E). G, Levels of SQSTM1 and LC3A/B isoforms levels in Eμ-Myc Lymphoma after treatment with the Myc inhibitor Myci361 for 2 hr or following culture in EBSS media for 6 hr. Actin was used as a loading control for all immunoblots. H and I, Autophagic flux analyses in (H) pre-B cells treated with 50 μM hydroxychloroquine (hCQ), as measured in cells cultured in normal vs. EBSS media for 6 hr, or in (I) BM-derived WT vs. Eμ-Myc pre-B cells. The ratio of GFP to mCherry from the retrovirally expressed mCherry-GFP-LC3 fusion protein was calculated and the percent of cells having high flux is shown (n = 3). Statistical analysis: A, B, E, and I, Student’s t-tests were performed. *, p ≤ 0.05; ***, p ≤ 0.001; ****, p ≤ 0.0001.
