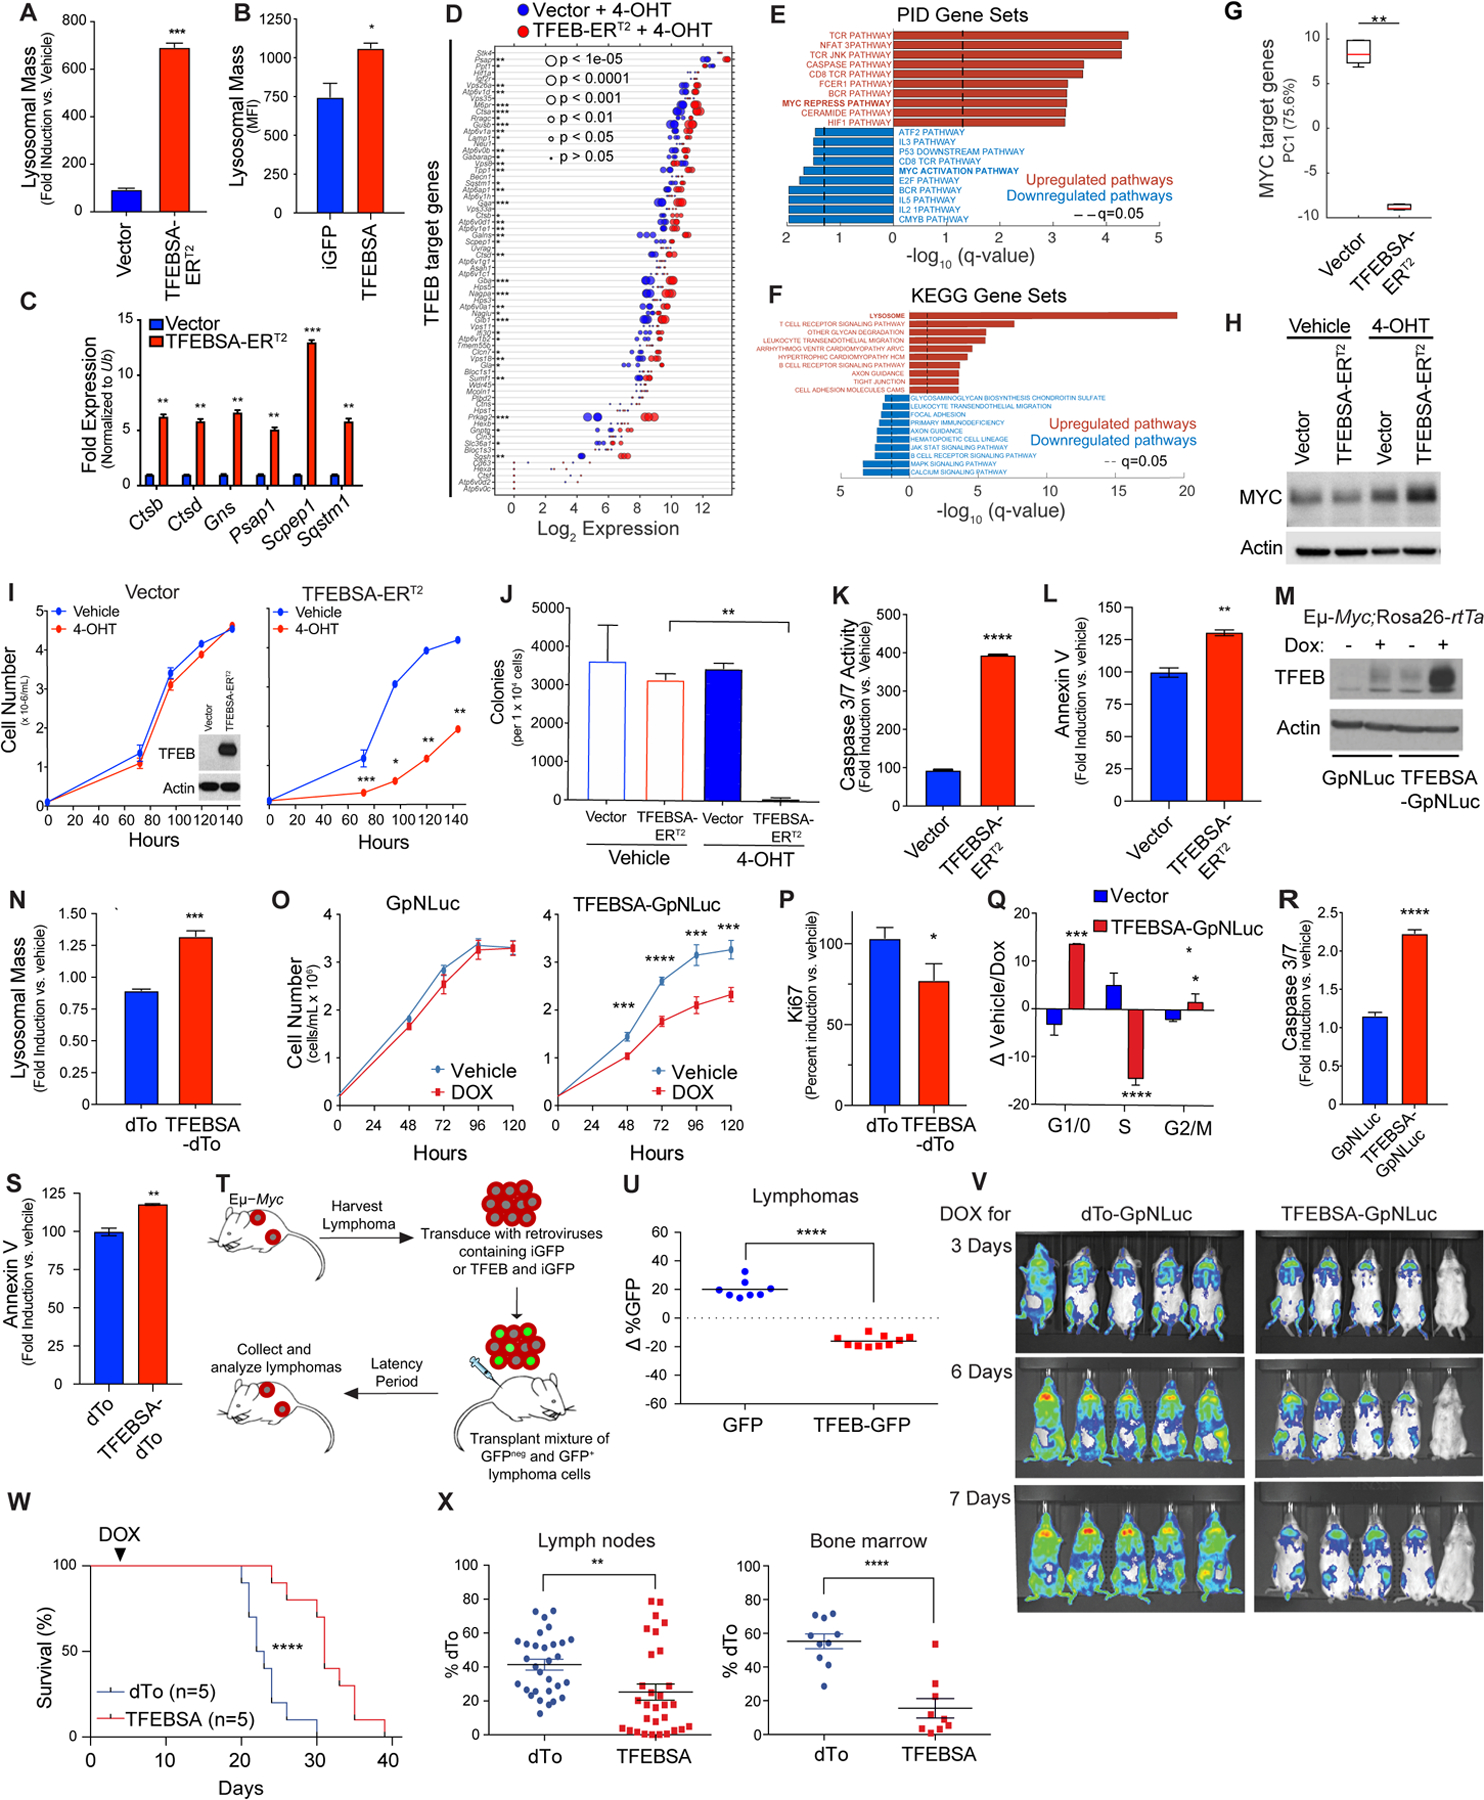
Figure 4.

TFEB functions as a tumor suppressor in Myc-driven lymphoma. A, Eμ-Myc lymphoma cells expressing vector or TFEBSA-ERT2 were treated with vehicle or 25 nM 4-OHT for 4 days and analyzed for lysosomal mass by flow cytometry after staining cells with Lysotracker DND99. B, Eμ-Myc lymphoma cells were transduced for 48 hr with retroviruses expressing GFP or TFEBSA plus GFP, and GFP+ cells were analyzed for lysosomal mass. C and D, Eμ-Myc lymphoma cells expressing vector or TFEBSA-ERT2 were treated as in (A), and then analyzed for the indicated TFEB target genes by qRT-PCR (C) or RNA-seq (D) (n = 3 for both). For (D) the Log2 gene expression profile of TFEB target genes is shown as a dot plot that is ordered based on expression; each dot represents one sample, and its size corresponds to its statistical significance as shown. E and F, Gene set enrichment analysis of significant, differentially expressed genes from RNA-seq analysis were performed using the (E) Pathway Interaction Database (PID) and (F) Kyoto Encyclopedia of Genes and Genomes (KEGG) databases. G, Box plot comparing the change of canonical MYC target genes (PC1) in Vector + 4-OHT vs. TFEBSA-ERT2 + 4-OHT RNA-seq data. H, Immunoblot analysis of Myc protein levels in Eμ-Myc lymphoma cells expressing vector or TFEBSA-ERT2 and treated as in (A). I-M, Eμ-Myc lymphoma cells expressing vector or TFEBSA-ERT2 were assessed for: (I) cell proliferation over 6 days (inset shows TFEBSA-ERT2 protein expression); (J) colony-forming potential in methylcellulose (day 14); and (K and L) apoptosis after 4 days of 4-OHT treatment, by measuring Caspase 3/7 and Annexin V staining, respectively (I-L, n = 3). M-S, Western blot analysis of TFEBSA and Actin protein levels (M) in Eμ-Myc;Eμ-rtTA2 lymphoma cells expressing vector (GpNLuc or dTo) or TFEBSA (TFEBSA-GpNLuc or TFEBSA-dTo) two days after treatment with vehicle or Dox; (N) Lysosomal mass of these cells treated +/− Dox (48 hr); (O) cell numbers over 120 hr; (P) cell proliferation index, as determined by Ki67 staining (48 hr); (Q) cell cycle analysis with propidium iodide (48 hr); and (R, S) apoptosis (Caspase 3/7 activity and Annexin V staining after 48 hr). T and U, Eμ-Myc lymphoma cells were transduced with retrovirus expressing GFP or GFP plus TFEBSA. (T) A 50:50 mix of control or TFEB-expressing GFP+:GFPNeg Eμ-Myc lymphoma cells from each transduction was transplanted i.v. into congenic recipient mice (n = 8). (U) Lymphomas arising in transplanted animals in (S) were assessed for percent of GFP+ lymphoma cells. V, In vivo imaging of Nod/Scid mice transplanted with Eμ-Myc;Eμ-rtTA2 lymphoma cells expressing vector (GpNLuc) or TFEBSA-GpNLuc at day 3, 6 and 7 after doxycycline (Dox) chow was provided ad libitum. W, Survival of syngeneic mice transplanted with Eμ-Myc;Eμ-rtTA2 lymphoma cells expressing vector (dTo) or TFEBSA-dTo; Dox chow was provided at day 3 post-transplant (arrow). X, Percent dTo+ B220+ cells isolated from lymph nodes or bone marrow of diseased recipient mice in (V). Statistical analysis: A-C, I-L, N-S, U and X: Students t-tests were performed. W, Chi-square test was performed. *, p ≤0.05; ** p ≤0.01; ***, p ≤ 0.001, ****, p ≤ 0.0001.
