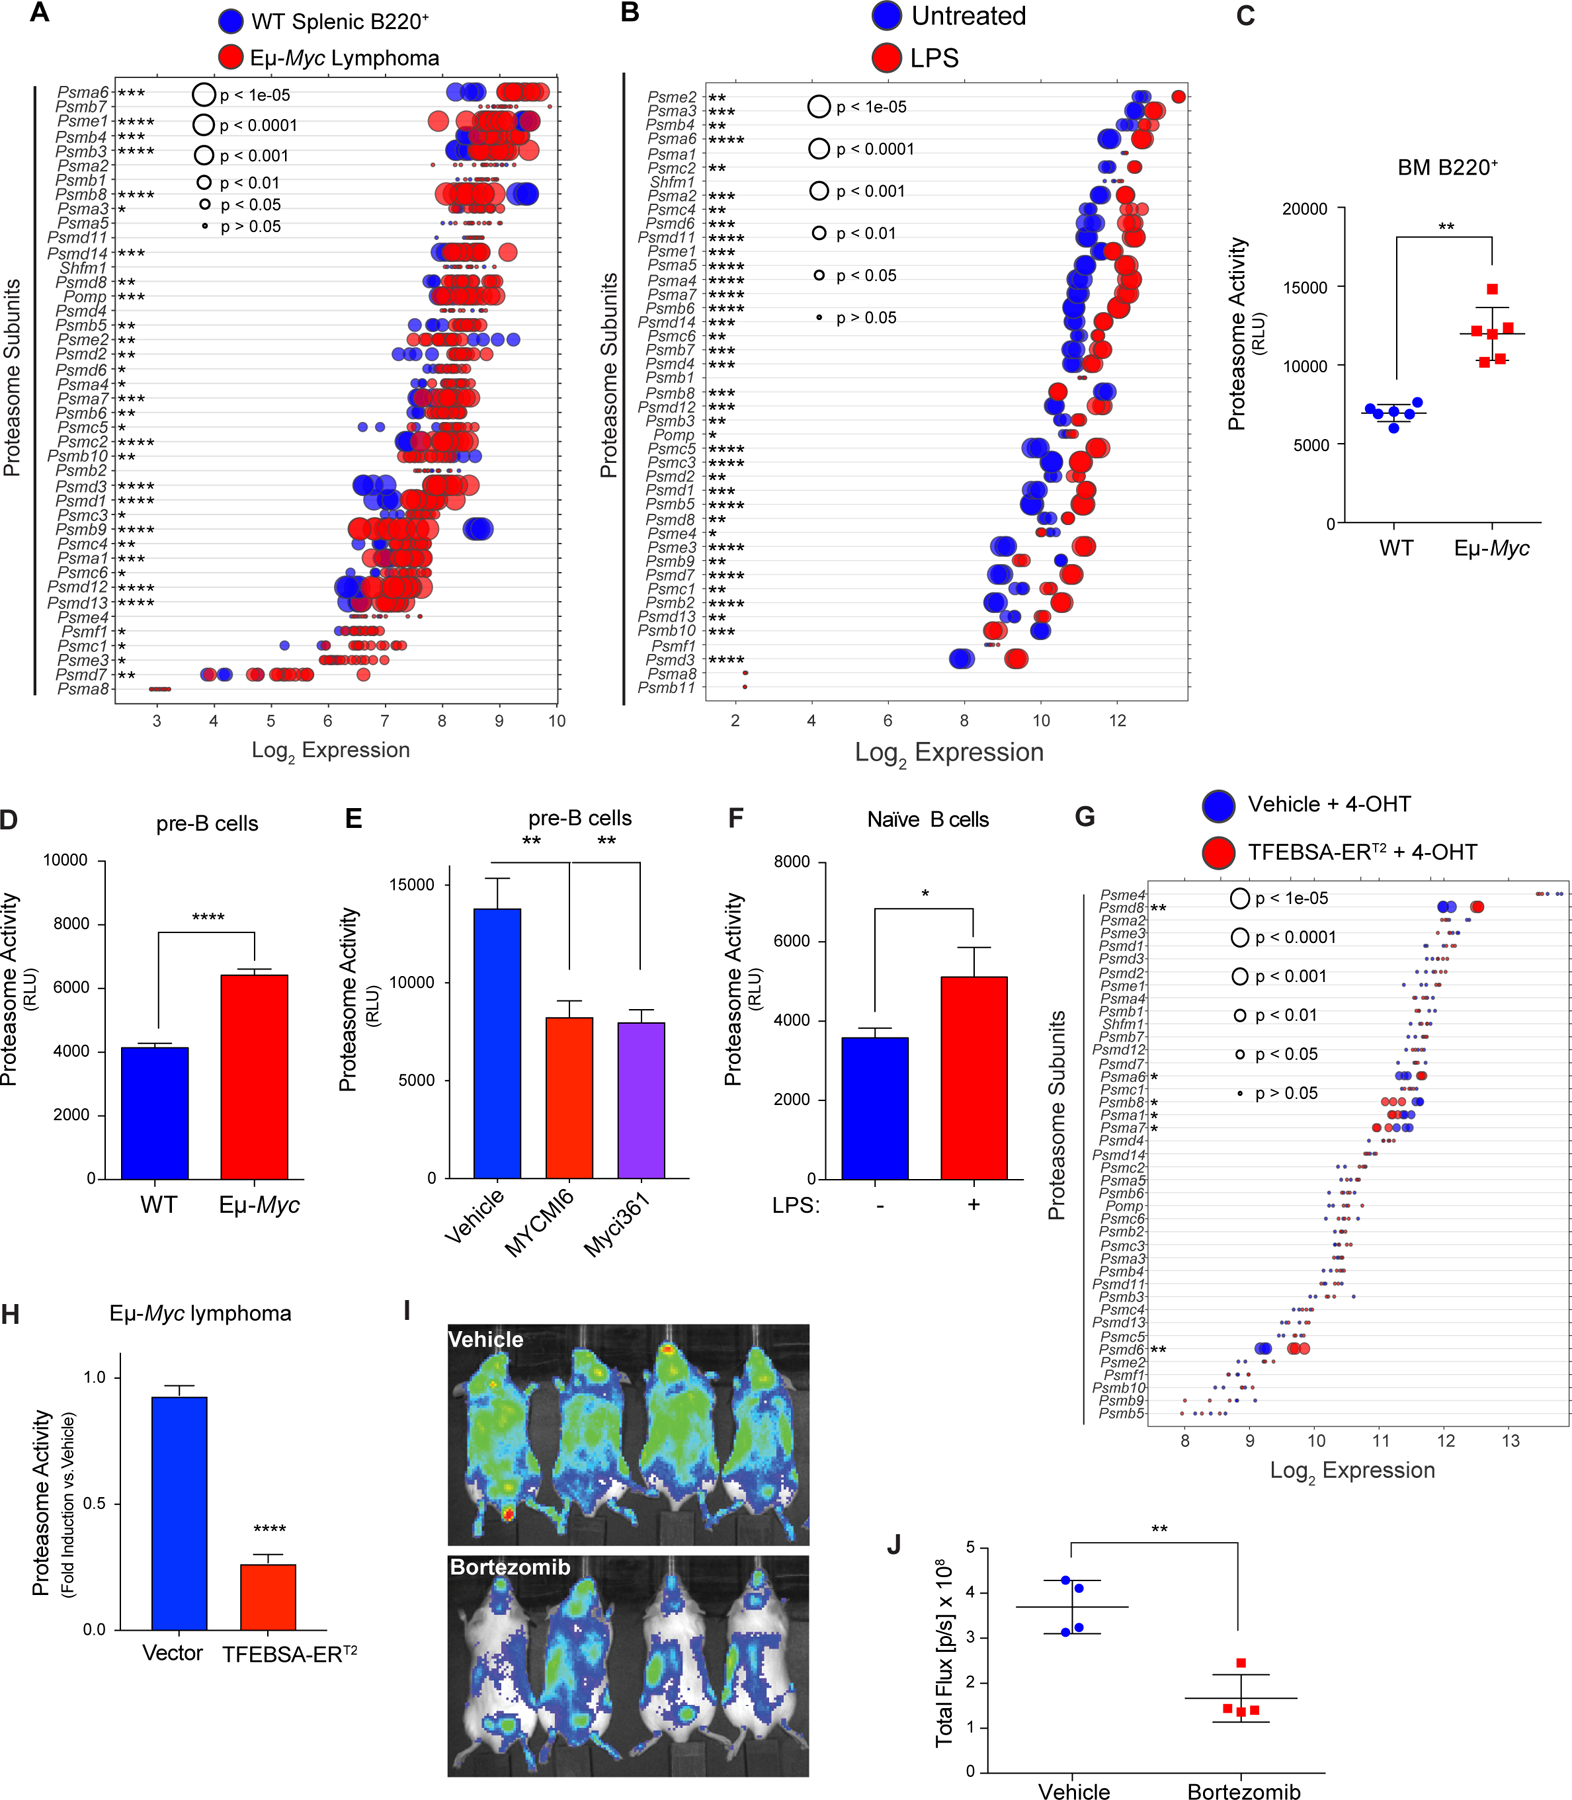
Figure 5.

MYC induces expression and activity of the proteasome in B cell lymphoma. A and B, Gene expression profile (A) of proteasome subunits in splenic B220+ B cells from wild-type (WT) and from Eμ-Myc lymphomas (GSE32239), and (B) of proteasome subunits in untreated vs. LPS (4 hr) stimulated naïve B cells (GSE37222). Log2 gene expression profile of TFEB target genes is shown as a dot plot ordered based on expression; each dot represents one sample, and its size corresponds to its statistical significance as shown. C-F, Proteasome activity was measured using Proteasome-Glo® in: (C) WT vs. Eμ-Myc B220+ BM cells (n = 6); (D) WT vs. Eμ-Myc pre-B cells cultured in IL7; (E) WT pre-B cells treated with vehicle or with the Myc inhibitors Myci361 or MYCMI6 for 2 hr; and (F) naïve mouse splenic B cells that were untreated (MYC-Off) or LPS-stimulated (4 hr, MYC-On) (D-F, n = 3). G, Log2 gene expression of proteasome-associated genes in Eμ-Myc lymphoma cells expressing vector or TFEBSA-ERT2 4 days after vehicle or 4-OHT treatment is shown as a dot plot ordered based on expression; each dot represents one sample, and its size corresponds to its statistical significance as shown (n = 3 for each cohort). H, Proteasome activity, measured using Proteasome-Glo®, in Eμ-Myc lymphoma cells expressing vector or TFEBSA-ERT2 after treatment with vehicle or 4-OHT for 4 days (n = 3). I and J, In vivo imaging of NOD-SCiD mice intravenously transplanted with Eμ-Myc;Eμ-rtTA2 lymphoma cells expressing either vector (GpNLuc) or TFEBSA-GpNLuc that were treated with vehicle or 0.25 mg/kg bortezomib (i.p. weekly) for 10 days (I). Average bioluminescence for treated with vehicle or Bortezomib for 10 days (J). Statistical analysis: C-F and J, Students t-tests were performed. *, p ≤0.05; ** p ≤0.01; ****, p ≤ 0.0001.
