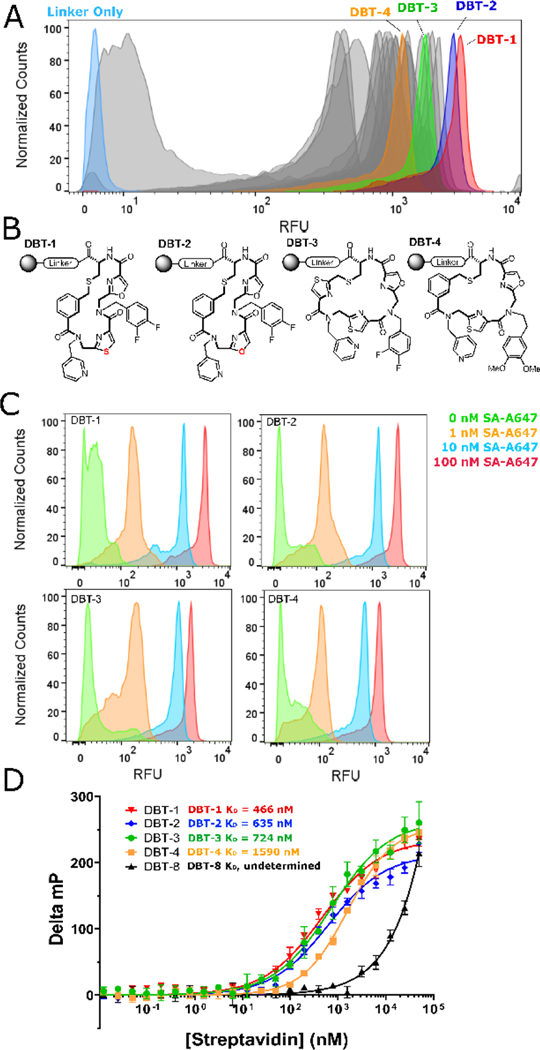
Figure 4:
Validation of screening hits. (A) FACS histogram showing the relative fluorescence of beads displaying resynthesized hits after incubation with 100 nM SA-A647. Highlighted samples were analyzed further. (B) Structures of the selected hits. (C) Titration of beads displaying DBT compounds with the indicated concentration of SA-A647, followed by FACS analysis. FACS histograms are shown. (D) Fluorescence polarization data for the selected DBT compounds.

