
Figure 2:
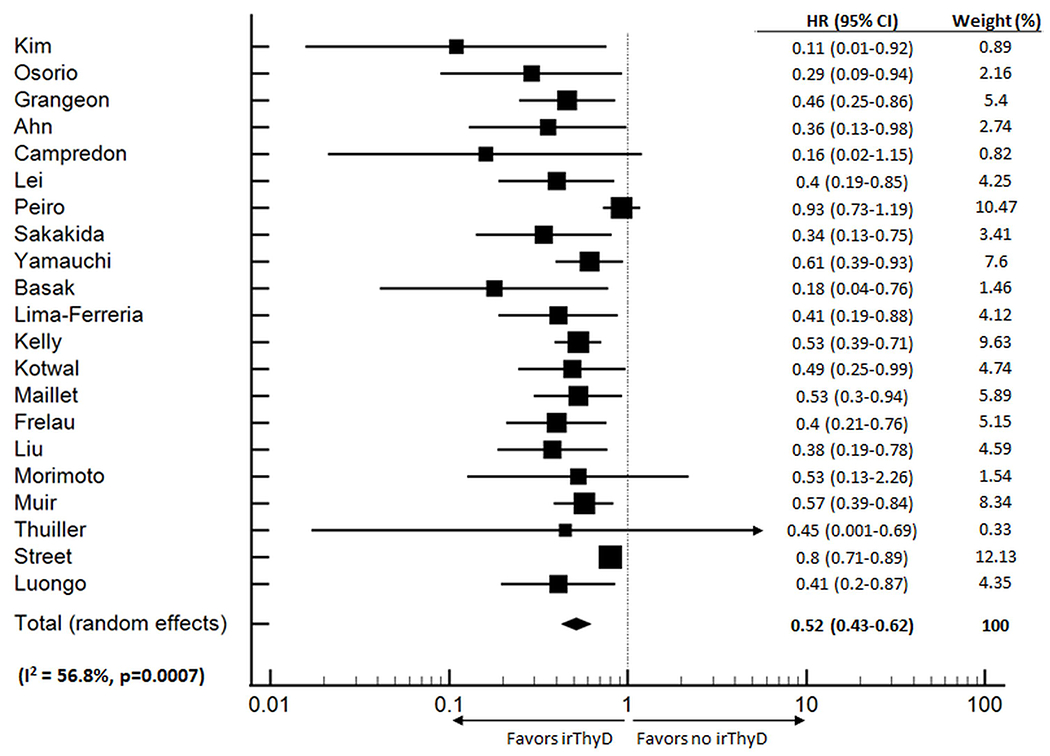
Forest Plot (random effects model) of the association between thyroid irAE development and overall survival
The size of the squares indicates the weight of each study.
Official websites use .gov
A
.gov website belongs to an official
government organization in the United States.
Secure .gov websites use HTTPS
A lock (
) or https:// means you've safely
connected to the .gov website. Share sensitive
information only on official, secure websites.
Forest Plot (random effects model) of the association between thyroid irAE development and overall survival
The size of the squares indicates the weight of each study.