Figure 4.
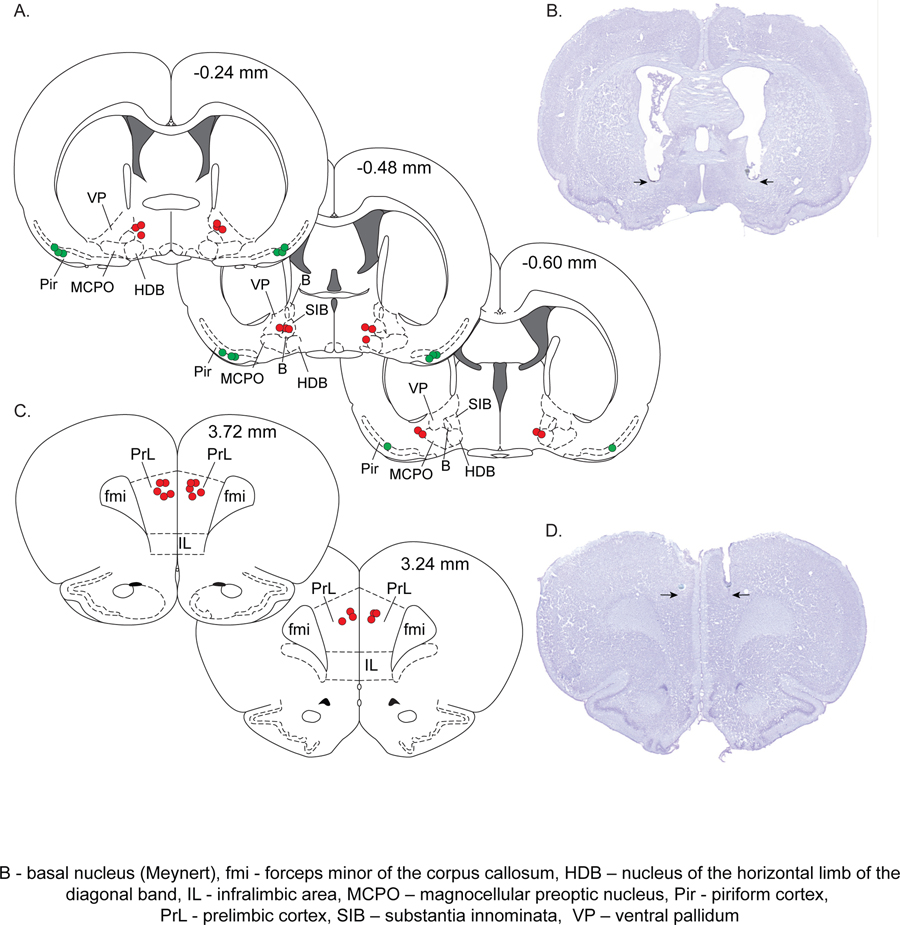
Histological verification of the sites of electrical stimulation in basal forebrain and piriform cortex, and tetrodotoxin microinjection sites in prefrontal cortex. A, Stereotaxic maps from rat brain atlas show the sites of electrical stimulation in basal forebrain (red dots) and piriform cortex (green dots). B, Cresyl violet-stained representative coronal brain section (30 μm) through basal forebrain shows the site of bilateral electrical stimulation (arrows). C, Stereotaxic maps from rat brain atlas show the sites of tetrodotoxin microinjection into prefrontal cortex (red dots). D, Cresyl violet-stained representative coronal brain section (30 μm) through prefrontal cortex shows the site of bilateral tetrodotoxin microinjection (arrows). The numbers on the top right of stereotaxic maps show the anteroposterior distance from Bregma: positive numbers are anterior to Bregma while the negative numbers are posterior to Bregma. B – basal nucleus (Meynert), fmi – forceps minor of the corpus callosum, HDB – nucleus of the horizontal limb of the diagonal band, IL – infralimbic area, MCPO – magnocellular preoptic nucleus, PrL – prelimbic cortex, SIB – substantia innominata, VP – ventral pallidum.

