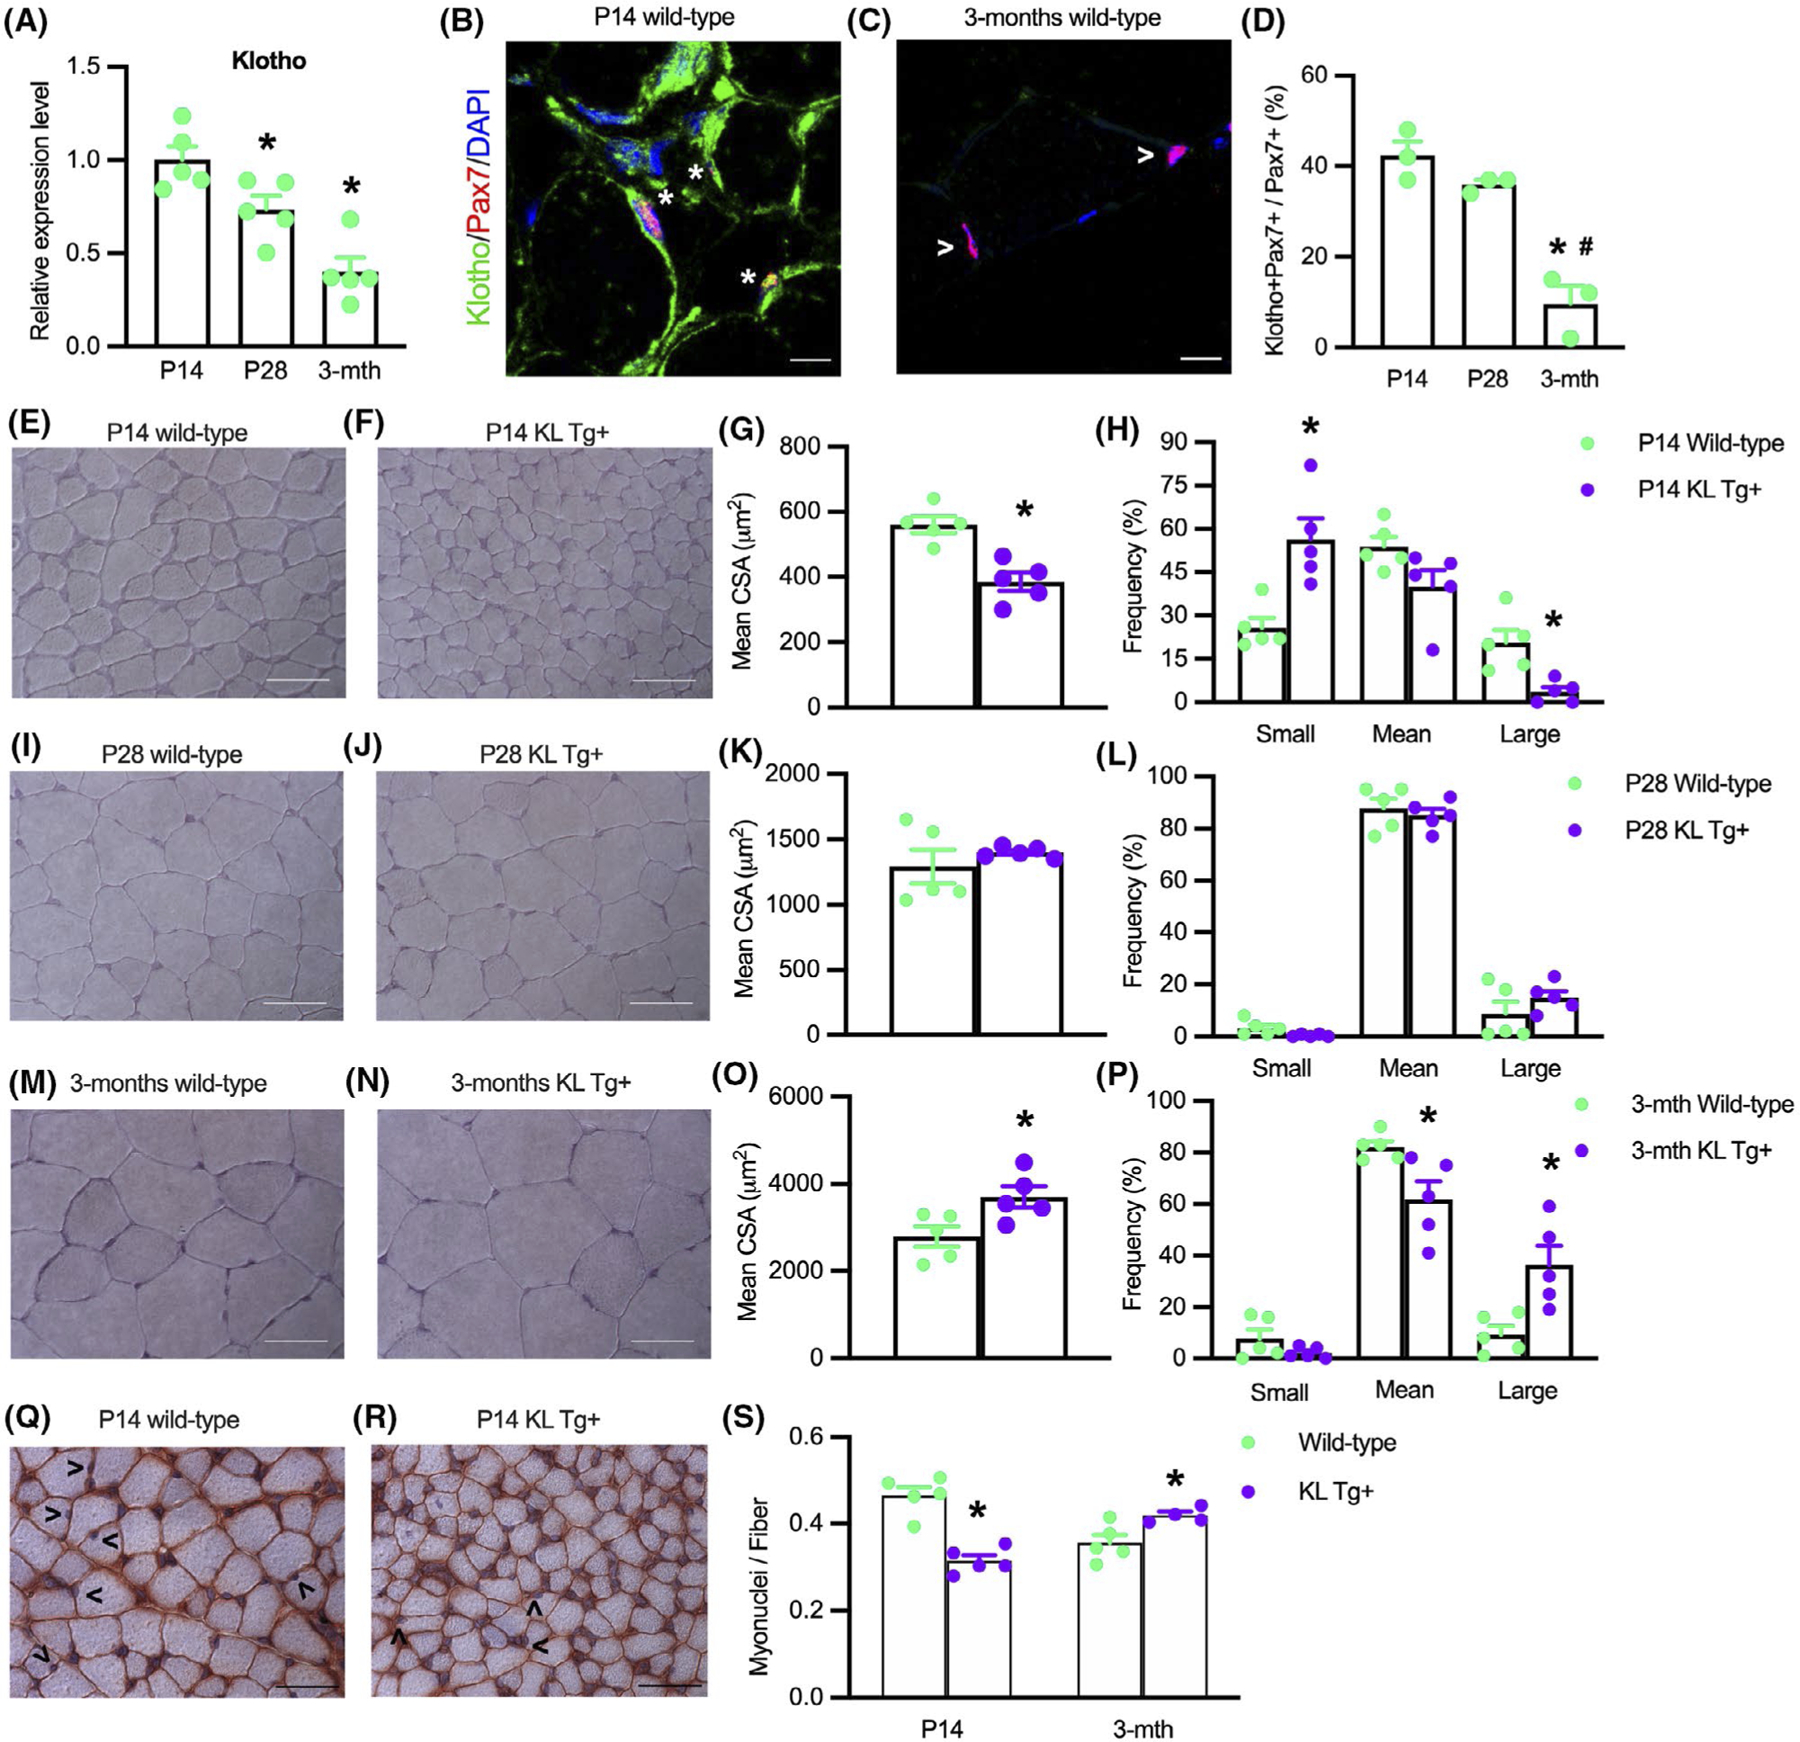
FIGURE 1.

Expression of a KL Tg affects muscle development. (A) QPCR data showing relative mRNA expression of klotho in quadriceps muscle lysates of P14, P28, and 3 months Wt mice. N = 5 per time point. *Indicates significantly different from P14 at p < .05 analyzed by one-way ANOVA followed by Dunnett’s multiple comparisons test. Error bar represents SEM. (B, C) Sections of P14 and months Wt quadriceps muscles labeled with anti-Pax7 (red), anti-Klotho (green), and DNA labeled with DAPI (blue). *Indicates Pax7+ cells that are also Klotho+. Open arrowhead (>) indicates Pax7+ single-labeled cells. Bars = 10 μm. (D) Ratio of Klotho+/Pax7+ cells to total Pax7+ cells in sections of quadriceps muscles. (E,F) Representative images of Wt (E) and KL Tg+ (F) quadriceps muscle at P14 stained with hematoxylin. Bar = 50 μm. (G) Mean cross-sectional area for quadriceps muscle fibers from P14 Wt and KL Tg+ mice. (H) Frequency distribution of fiber cross-sectional areas for quadriceps muscles at P14 from Wt and KL Tg+ mice. N = 5. (I, J) Representative images of Wt (I) and KL Tg+ (J) quadriceps muscle at P28 stained with hematoxylin. Bar = 50 μm. (K) Mean cross-sectional area for quadriceps muscle fibers from P28 Wt and KL Tg+ mice. (L) Frequency distribution of fiber cross-sectional areas for quadriceps muscles at P28 from Wt and KL Tg+ mice. (M, N) Representative images of Wt (M) and KL Tg+ (N) quadriceps at 3 months stained with hematoxylin. Bar = 50 μm. (O) Mean cross-sectional area for quadriceps muscle from 3 months Wt and KL Tg+ mice. (P) Frequency distribution of fiber cross-sectional areas for quadriceps muscles at 3 months from Wt and KL Tg+ mice. For G, K, and O, * indicates significantly different from the mean cross-sectional area of age-matched Wt fibers at p < .05 analyzed by t-test. Error bar represents SEM. N = 5. For H, L, and P, * indicates significantly different from age-matched Wt fibers of the same sized group at p < .05 analyzed by t-test. Error bar represents SEM. N = 5. (Q, R) Representative images of Wt (Q) KL Tg+ (R) quadriceps at P14 stained with anti-dystrophin and hematoxylin. Open arrowhead (>) indicates myonuclei. Bar = 50 μm. (S) Numbers of myonuclei per fiber in quadriceps from Wt and KL Tg+ mice at P14 and 3 months. *Indicates significantly different from age-matched Wt fibers at p < .05 analyzed by t-test. Error bar represents SEM. N = 5
