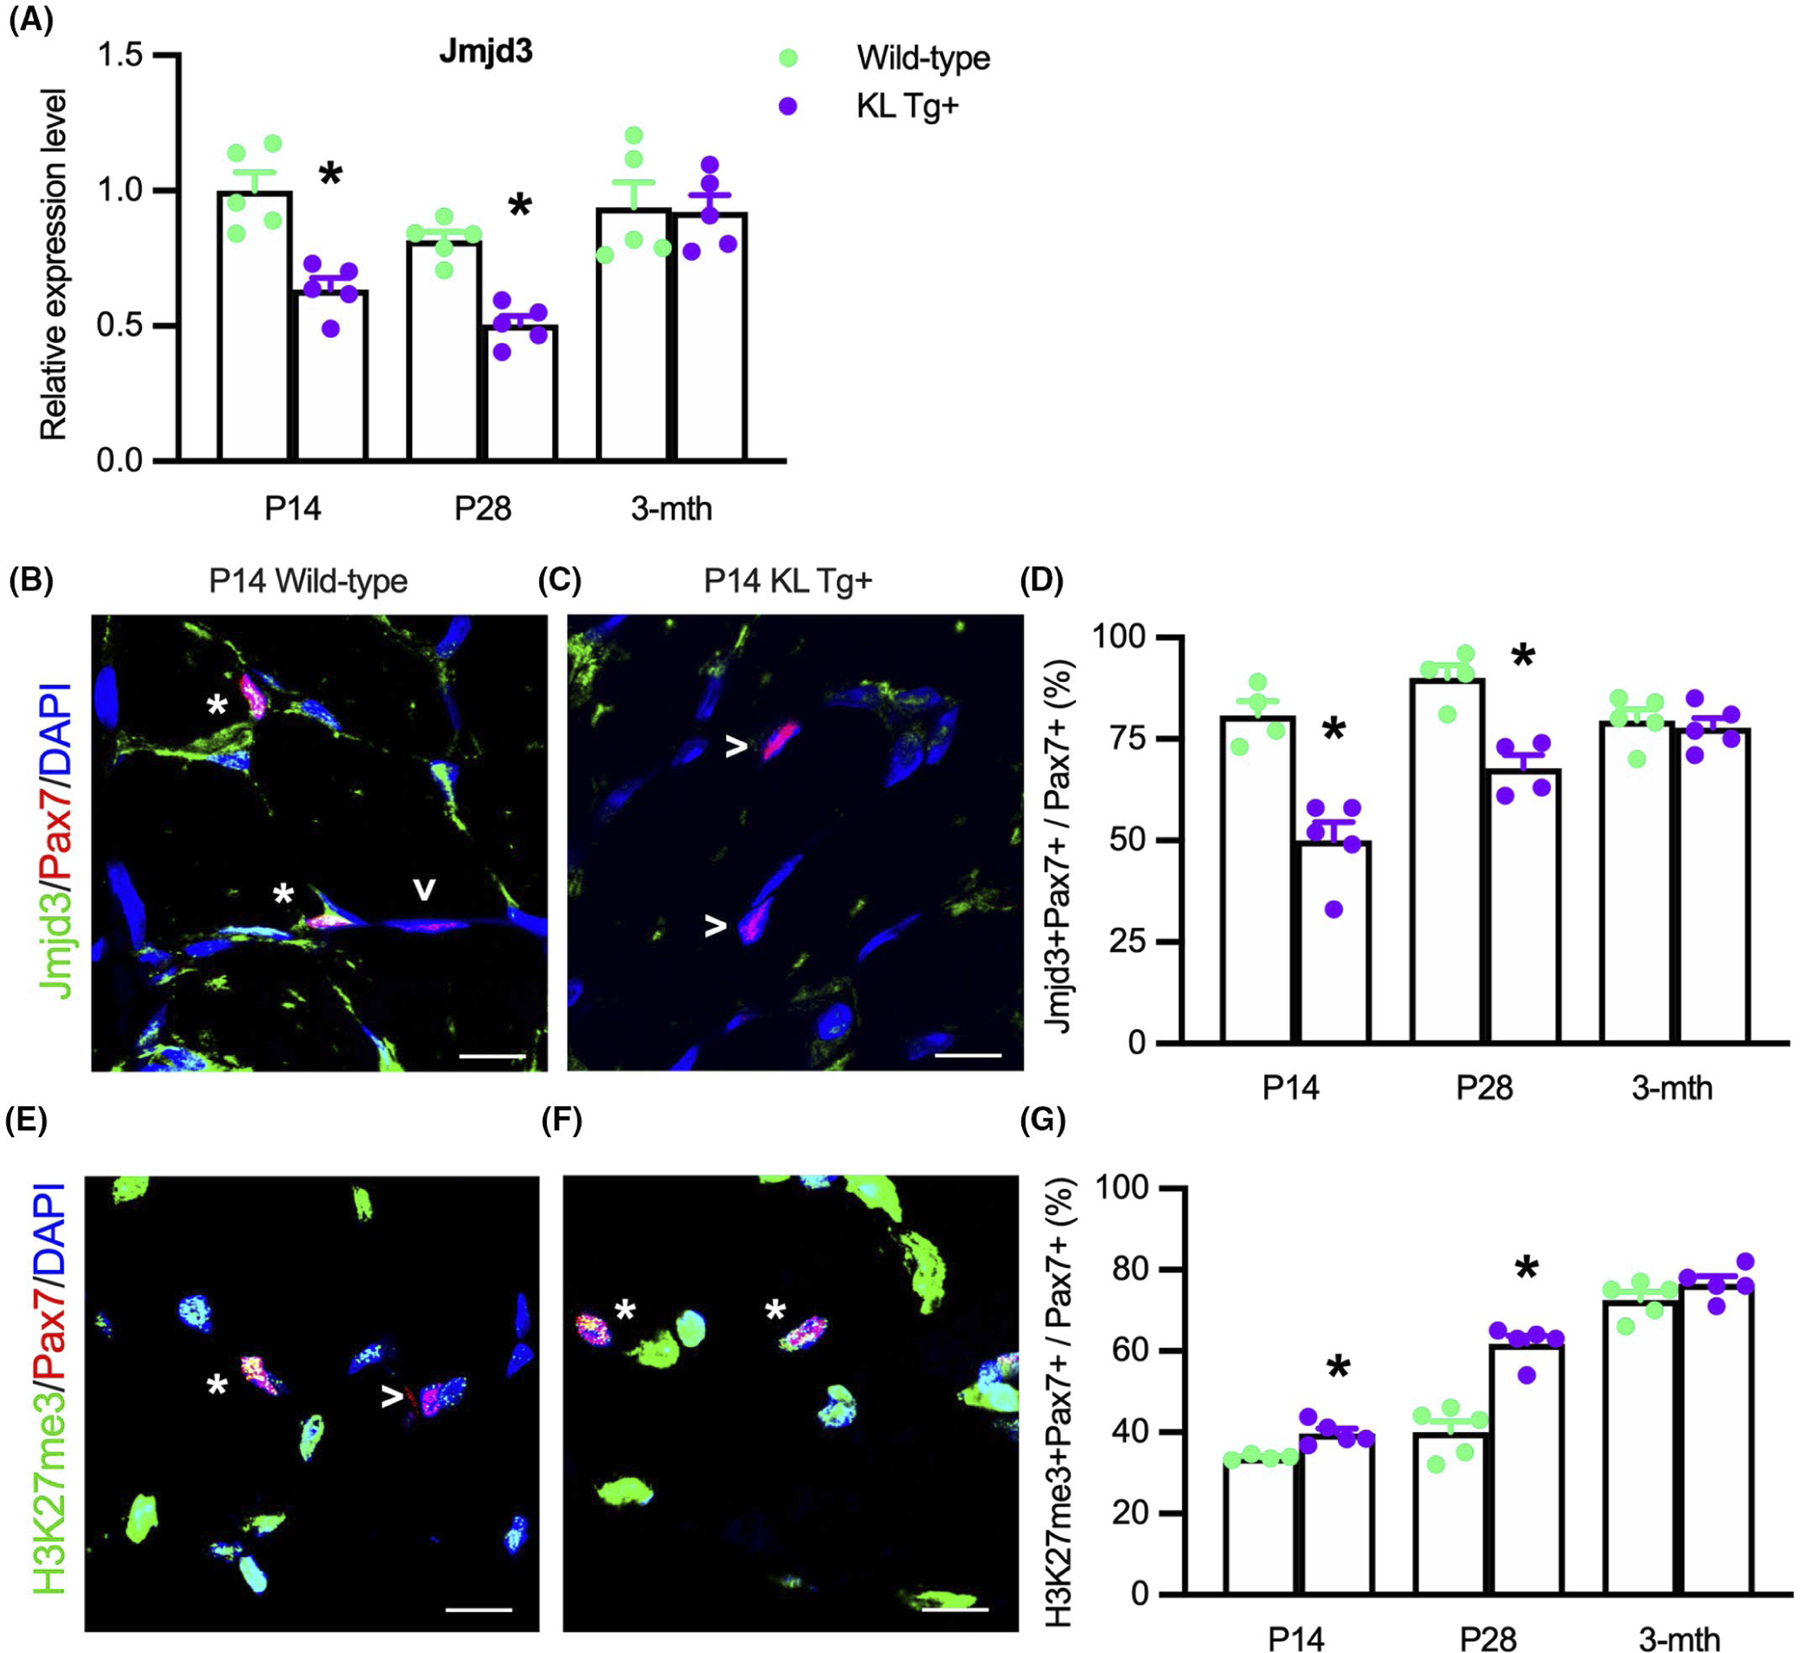
FIGURE 8.

KL Tg expression reduces Jmjd3 transcripts and localization in Pax7+ cells and increases H3K27 methylation Pax7+ cells in early postnatal development. (A) QPCR analysis showing Jmjd3 in quadriceps muscle lysates of Wt and KL Tg+ mice. (B, C) Representative images of quadriceps muscle sections from P14 Wt (B) and KL Tg+ (C) mice showing immunofluorescent double-labeling for Pax7 and Jmjd3. *Indicates Pax7+ cells that were also Jmjd3+. Open arrowheads (>) indicate Pax7+ single-labeled cells. (D) The ratio of Jmjd3+/Pax7+ cells to total Pax7+ cells in sections of quadriceps muscles. (E,F) Representative images of P14 Wt (E) and KL Tg+ (F) showing immunofluorescent double labeling for Pax7 and trimethylated H3K27 (H3K27me3) in quadriceps muscle cross-sections. *Indicates Pax7+ cells that were also H3K27me3+. Open arrowheads (>) indicate Pax7+ single-labeled cells. (G) The ratio of H3K27me3+/Pax7+ cells to total Pax7+ cells in quadriceps muscles sections. For all bar charts, *indicates significantly different from age-matched Wt at p < .05 analyzed by t-test. Error bar represents SEM. N = 4 or 5 for each data set
