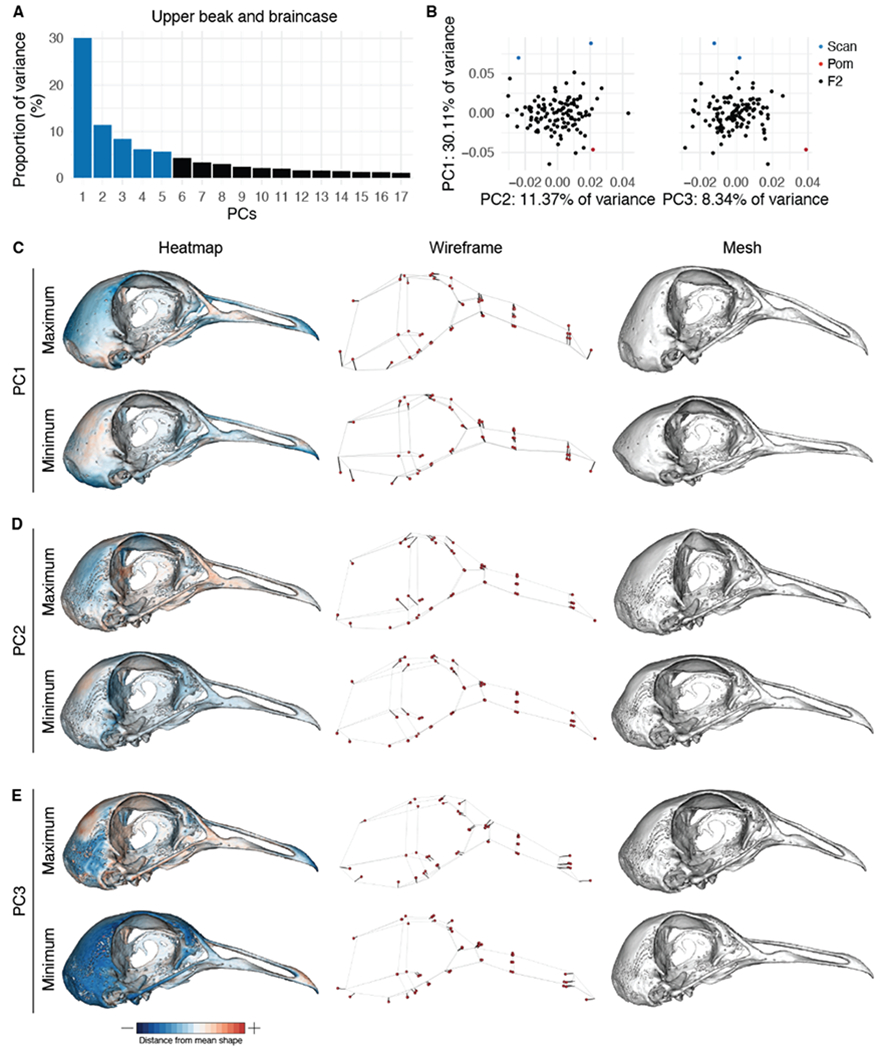
Figure 3. Upper beak and braincase (UBB) shape variation in the Pom x Scan F2 population.

(A) Principal components (PCs) that collectively explain 90% of UBB shape variation. PCs that account for more than 5% of variation are indicated in blue. (B) PCA plots of PC1 vs. PC2 (left) and PC1 vs. PC3 (right). Founders are highlighted in blue (Scan) and red (Pom), F2 birds are denoted in black. (C-E) Visualizations of PC1 (C), PC2 (D), and PC3 (E) minimum and maximum shapes in three ways: heatmaps displaying distance from mean shape (left), wireframes showing displacement of landmarks from mean shape (center), and warped meshes (right). For wireframes and meshes, shape changes are magnified to aid visualization: 1.5x for PC1, 2x for PC2, 3x for PC3.
