Figure 2.
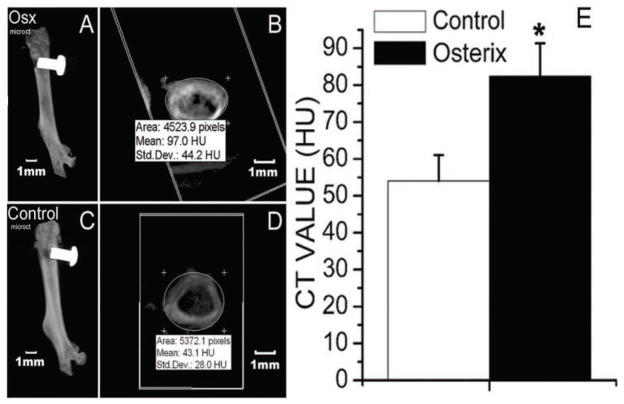
MicroCT analysis indicated that, 14 days after implantation, implants were successfully integrated with the host bone tissues in both the Osx group (A) and the control group (C). The CT value of newly formed bone area surrounding the implant in both the Osx (B) and control (D) groups, demonstrated by Hounsfield Units (HU), was determined by means of the eFilm Workstation 2.12. (E) The CT value of the newly formed bone area surrounding the implant was higher in the Osx group than in the control group. Data are presented as means ± SE (n = 8). *p < 0.05, Osx group vs. control group.

