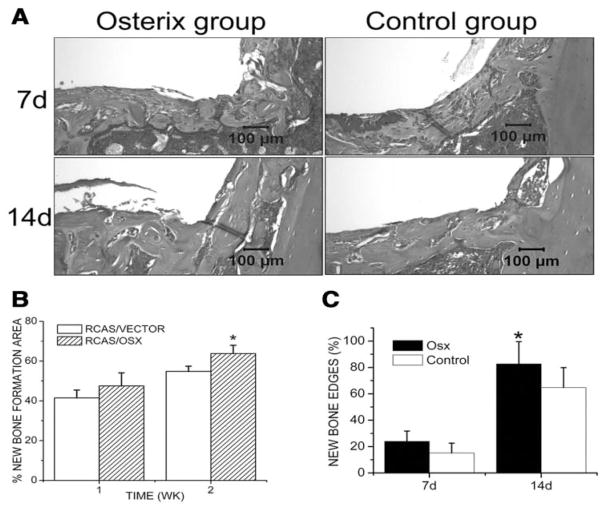
Figure 3.
Histomorphometric analysis. (A) H&E-stained tissue sections from different groups. (B) The percentages of newly formed bone area at the implantation sites and (C) the percentages of new bone edges in direct contact with the implants were determined at day 7 and day 14 post-operatively. Data are presented as means ± SE (n = 8). *p < 0.05, RCAS/VECTOR vs. RCAS/OSX.

